
The 528 line
by Kirsty McCabe, FRMetS
Forecasting snow in the UK is a tricky business and requires two key ingredients: a source of moisture to form precipitation, and cold enough air for that precipitation to fall to the ground as snow).
The presence of weather fronts on a pressure chart tells us if we’ve got the moisture ingredient sorted, but how do we know that the atmosphere will be cold enough for snow? The answer lies in the air’s ‘thickness’, which meteorologists measure by looking at the vertical distance between two pressure levels, usually the 1000 and 500 millibar levels. This roughly equates to the bottom half of the atmosphere because 1000 mb is somewhere near the ground, and 500 mb is somewhere in the middle of the troposphere. The actual height of the 500 mb level depends on the temperature of the air.
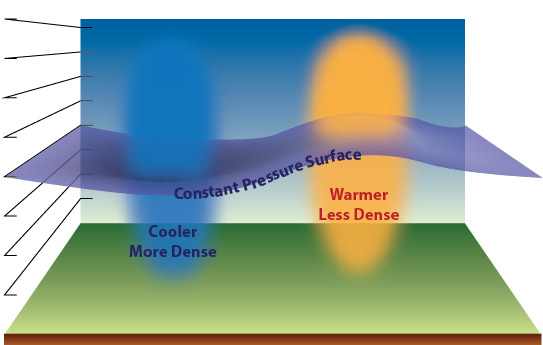
Warm air is less dense than cold air, so the vertical distance between the two pressure levels will be greater, and the slice of atmosphere will be ‘thicker’. Cold air being denser will occupy less space, so the 500 mb level will be lower in the atmosphere, and the corresponding thickness will be lower. So the thickness gives us an indication of the temperature of the atmosphere.
Take another look at the pressure chart above. The solid black lines, or isobars, join areas of equal atmosphere pressure. But if you look closely, you can see red dashed lines on there too. These are lines of constant height or thickness lines, and they often have numbers like 528, 546 or 564 next to them.
As a rule of thumb, ‘tropical’ air has a thickness of 5640 metres or greater. This is the vertical distance between the 1000 and 500 mb pressure levels. We usually shorten this to 564 decametres or 564 dam. So, spotting a 564 thickness line on the chart would imply very warm or heatwave conditions for the UK.

Of course, we want the snow line, and that’s where the magical 528 comes in, as this is generally regarded as the dividing line between snow and rain. When the thickness is 5280 m, or 528 dam, then we can expect a polar air mass. If the 528 line is to the north of the UK, then we’re likely to get rain, but if it lies to the south of us (as in the forecast pressure chart above), the chances of snow are much greater. And if you spot the 510 line over the UK – well, best dust off that sledge!
Ever looked at a synoptic or pressure chart and felt a bit lost? They can seem a bit daunting at first, what with all the different coloured lines, semicircles and triangles; but weather charts are actually quite simple to interpret.


")
