
Climate of 2018 - WMO State of the Climate report released
For the 25th time, the World Meteorological Organization (WMO) published a statement on the State of the Global Climate. The latest report was launched at the United Nations headquarters in New York on the 28th March. It looks back at the climate of 2018 globally.
Every year, numerous National Meteorological and Hydrological Services across the world and other national and international organizations contribute to the publication. Besides surface temperature, which is commonly reported, the report takes also other global climate indicators into account. These include ocean heat, atmospheric carbon dioxide (CO2) concentrations, ocean acidification, sea level, glaciers and sea ice extent at the poles.
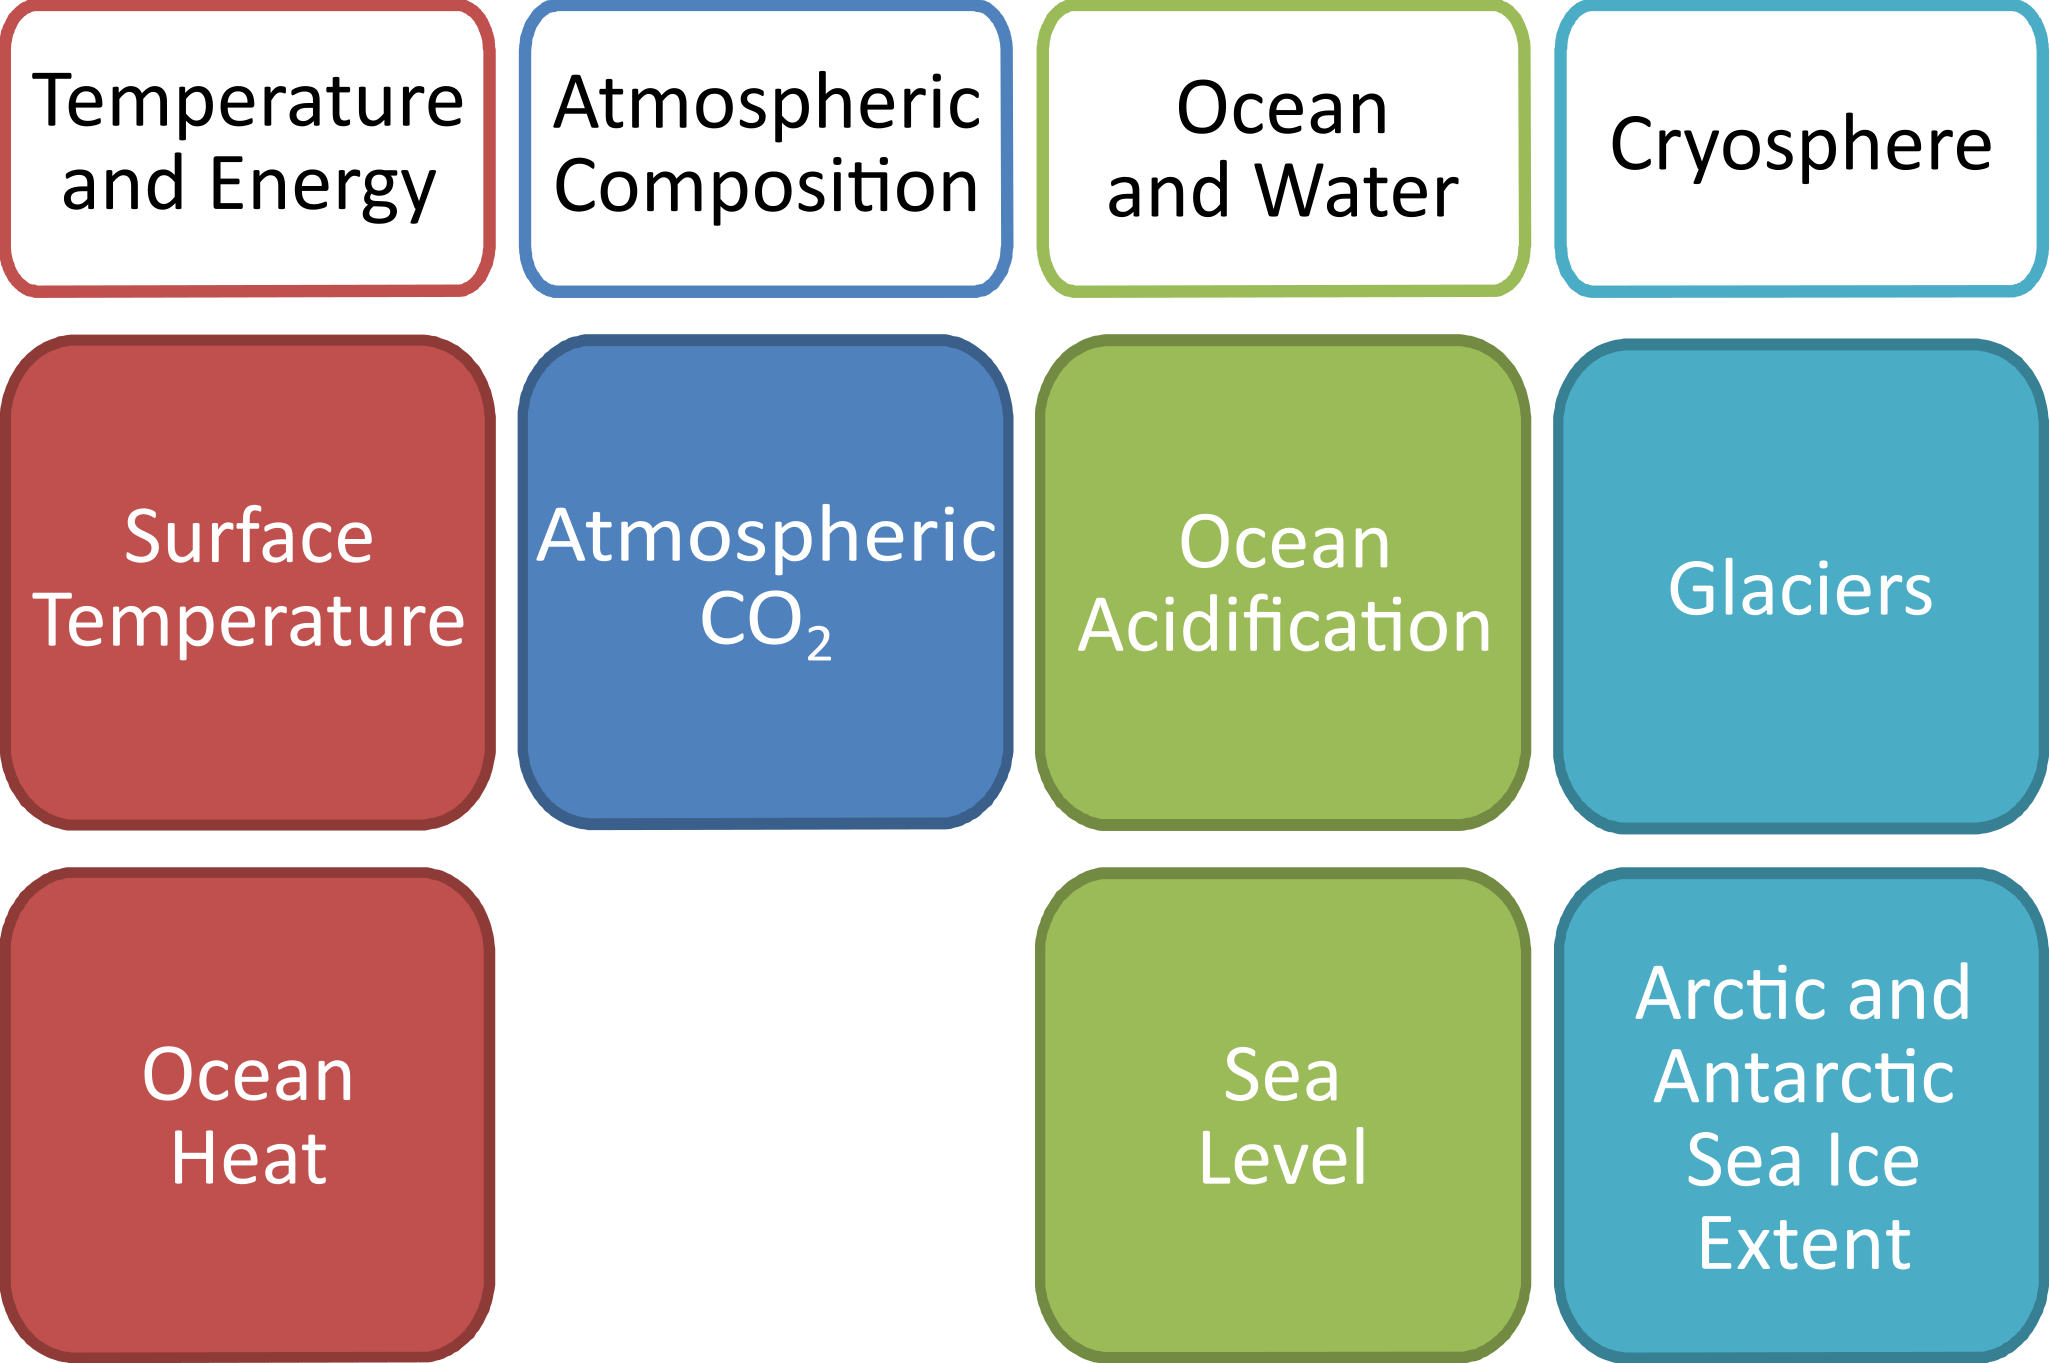
The Global Climate Indicators used by the WMO for monitoring global climate. (Source: Global Climate Observing System / WMO)
The key findings of the report focus on the seven climate indicators. The global average surface temperature in 2018 has nearly reached 1°C above the pre-industrial period (1850-1900). The past four years, 2015 to 2018, were the warmest on record. In 2018, several countries experienced their warmest year on record: The Czech Republic, France, Germany, Hungary, Serbia and Switzerland. The graphic below depicts surface air temperature anomaly globally (left) and with a focus on Europe (right) for 2018. Air temperatures were much above average (relative to the reference period 1981-2010) in the Arctic, with peaks north of Svalbard and over the Chuckchi and Bering seas. Most continental areas experienced average temperatures above the 1981-2010 mean. Some areas, marked in blue colours in the graphic below, experienced temperatures below average. These include areas of Canada, southern Greenland, parts of Kazakhstan and southern Russia, and fractions of the Atlantic, Pacific and Antarctica.
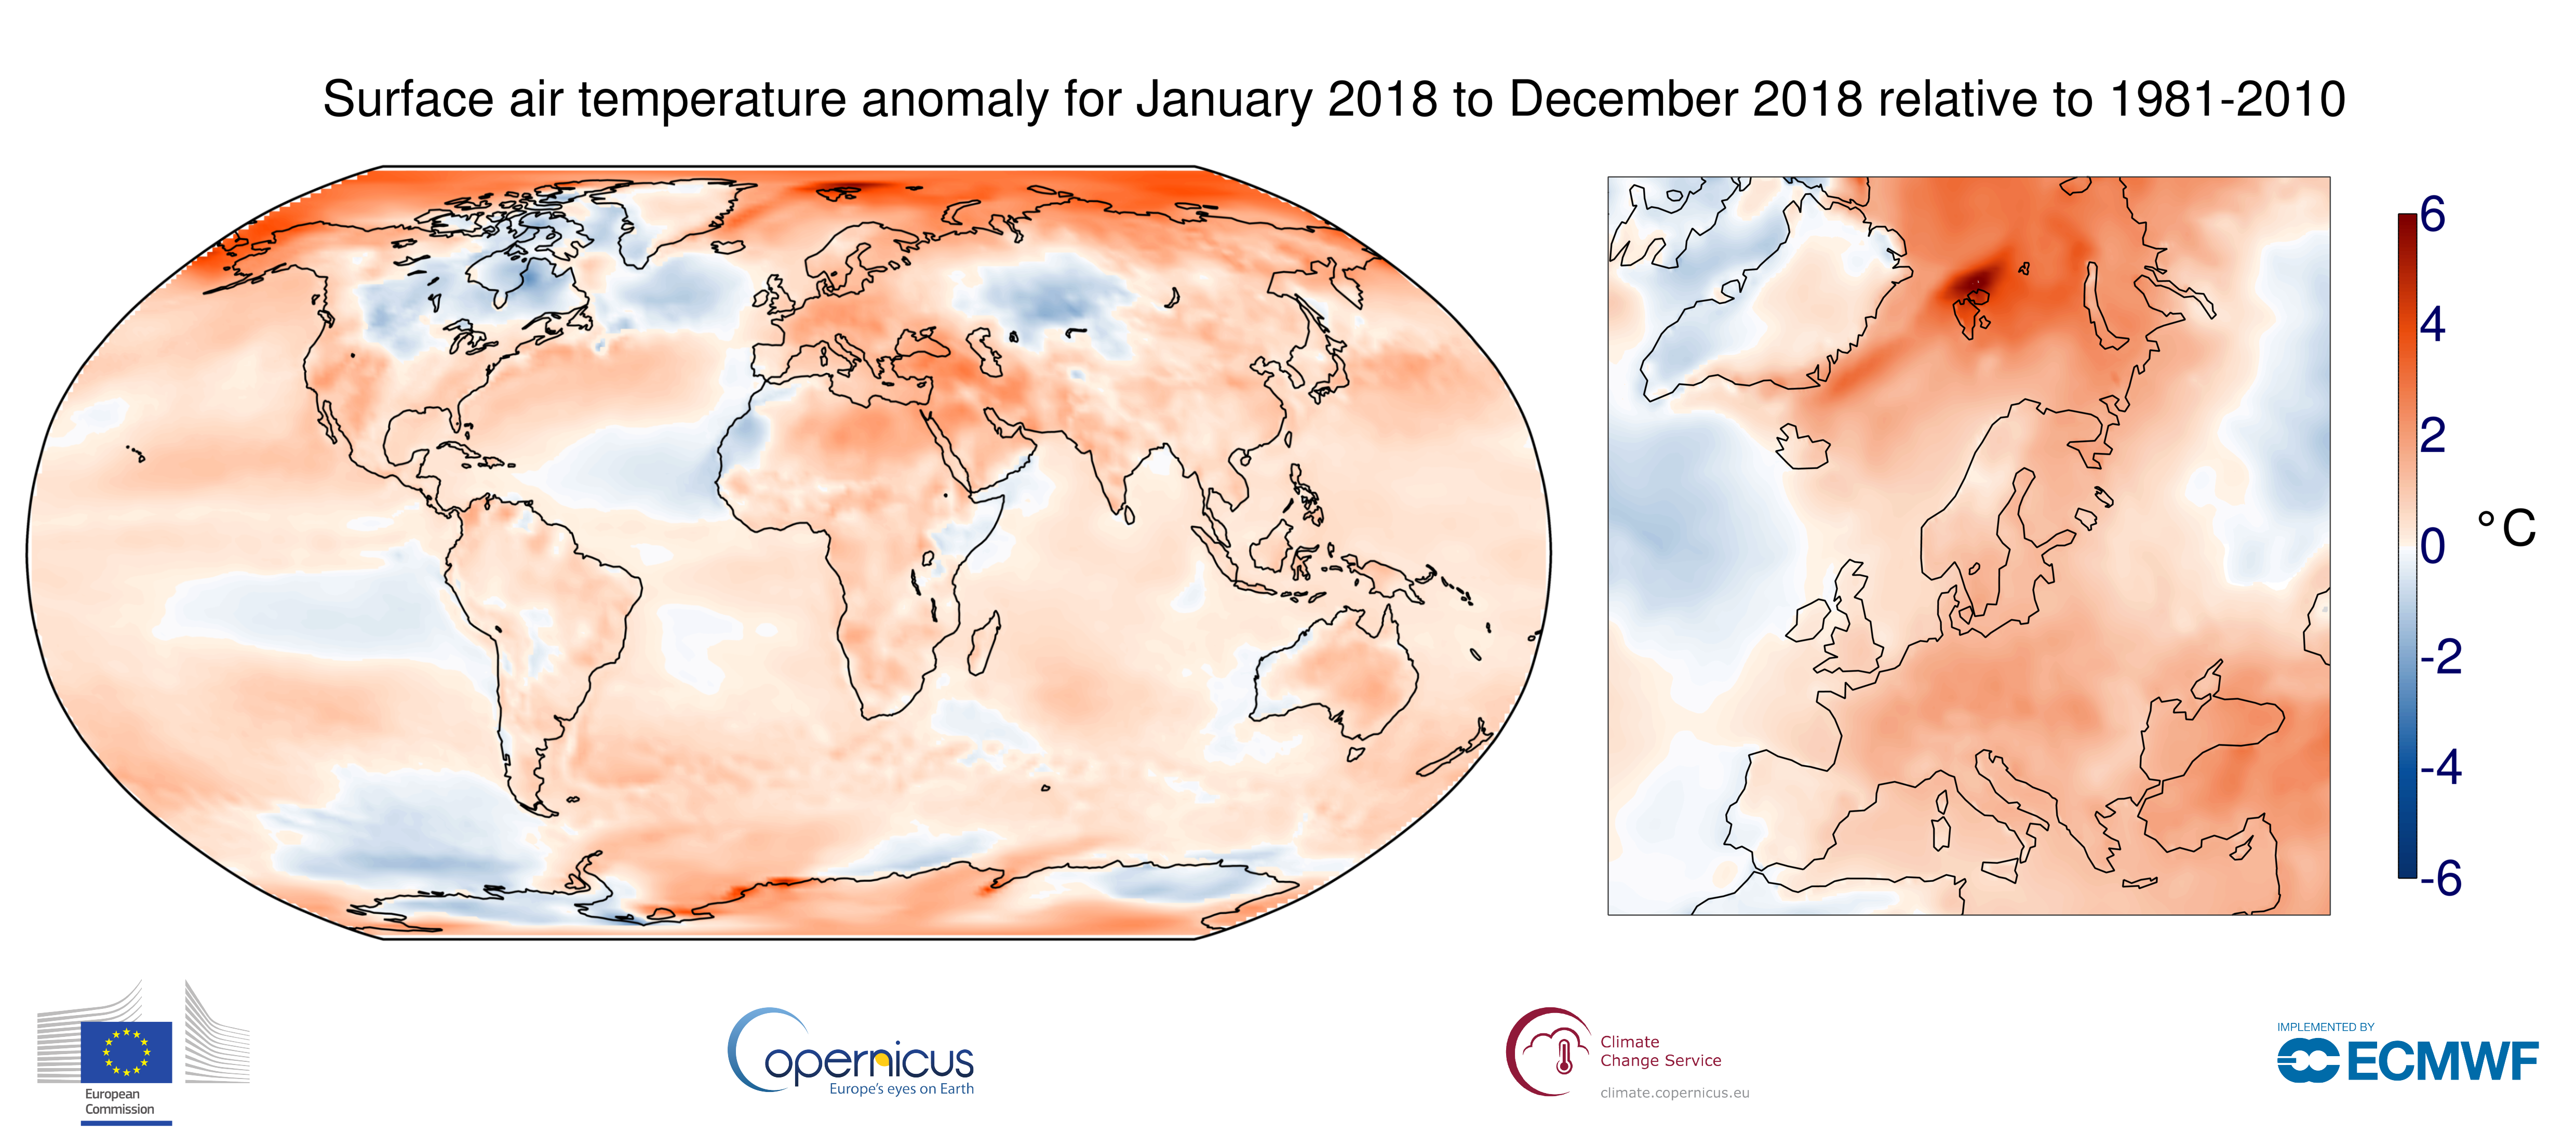
Surface air temperature anomaly for 2018 relative to 1981-2010 (Copernicus)
Global figures of greenhouse gas concentrations in the atmosphere will only become available in late 2019. However, real-time data from specific locations such as Mauna Loa (Hawaii) and Cape Grim (Tasmania) showed that concentrations of CO2, methane and nitrous oxide continued to increase throughout 2018. The WMO report states that global greenhouse gas concentrations in 2017 constituted 146 % (carbon dioxide), 257 % (methane) and 122 % of pre-industrial levels.
Sea surface waters in several ocean areas were reported as unusually warm during 2018. This include wide areas of the Pacific (except the eastern tropical Pacific and an area north of Hawaii), the western Indian Ocean, tropical Atlantic and the area of the North Atlantic extending from the eastern coastline of the United States. The year of 2018 has set a new record for ocean heat contents in the 0-700 m depth ocean layer, for which data is available since 1955 and in the 0-2000 m depth ocean layer, for which data is available since 2005.
Sea level rise has continued to increase during 2018, reaching the highest on record. Between 1993 and 2018, the yearly average sea level rise amounted to 3.15 ± 0.3 mm per year, and an additional acceleration of 0.1 mm per year was estimated. This accelerated rate is attributed to accelerated ice mass loss from the ice sheets.
The world oceans are a sink for CO2 by absorbing it from the atmosphere. This absorbed CO2 reacts with the ocean water and leads to lowering the pH of the ocean water. This process, also known as ocean acidification, has important impacts on marine organisms such as the bleaching of corals. Continuous records of pH are not yet available globally, but only from few long-term observation stations. They include the Hawaii Ocean time series in the Pacific, the Bermuda Atlantic time series and the European Station at the Canary Islands. All the stations show a decreasing pH since 1990.
Sea ice extent in the Arctic and Antarctica was well below average relative to the 1981-2010 reference period. The annual minimum in the Arctic occurred in September with 5.45 million km2, which is about 28 % below average. In Antarctica, the annual minimum extend was recorded in late February with 2.28 million km2, 33 % below average. 2018 was another year of global glacier mass loss based on preliminary results provided by the World Glacier Monitoring Service (WGMS). The hydrological year of 2017/18 (hydrological years are different from calendar years, because they start and end in the fall) was the 31st year in a row with a negative mass balance. It was reported that the Swiss glaciers lost a mean of 1.5 to 2 metres of ice thickness due to the warm summer months.
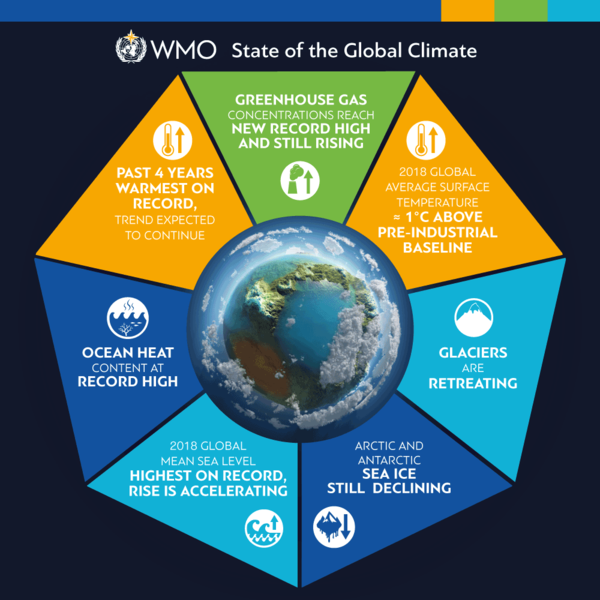
Highlights from the 2018 State of the Global Climate Report (WMO)
The report further looks back at extreme events during 2018, which include tropical cyclones (Mangkhut/Ompong being one of the strongest), flooding, heatwaves, cold and snow, wildfires and severe storms. Attributing these extreme events to anthropogenic climate change is an ongoing effort.
The report also includes the overall impacts of weather and climate events. Approximately 60 million people were affected by floods, droughts, storms, extreme temperatures and wildfires. The event that affected the largest amount of people (over 35 million) was flooding, followed by storms (nearly 13 million) and droughts (over 9 million). Global statistics on the economic losses due to these events are not yet available. The economic loss of the United States due to Hurricanes Florence and Michael is estimated at nearly 50 billion US$. The report further states that over 2 million people were displaced as a result of disasters linked to weather and climate (as of September 2018). The Displacement Tracking Matrix (DTM) reports a total of 17.7 million people as displaced in 2018.
United Nations Secretary General António Guterres calls this report “yet another strong wake-up call”. He said: “I am telling leaders: 'Don’t come with a speech; come with a plan'”.


