
Highs and lows of daily temperature records
During summer heatwaves or severe winter cold spells, everybody wants to know if such high or low temperatures are unusual, or indeed record-breaking. Given that unseasonably warm and cold spells affect the UK most years, this interest in climatic extremes is nothing new. But creating an official list of daily temperature records for the UK was no easy task.
The legendary hot summer of 1976 prompted re-assessments of old extremes. One such record was the reading of 100.5 °F (38.1 °C) at Tonbridge in Kent, on 22 July 1868, which had long been cited as Britain's highest recorded temperature; until the reading was re-examined with the conclusion that the exposure was not quite comparable to later standards. The extreme cold during the winter of 1981-1982 likewise brought a corresponding flurry of interest in low temperature records. Events like these highlighted the need for an authentic list of records with which to compare recent values for possible new extremes, and to give perspective to unusual temperatures at any time of year. Such a list would highlight the earliest and latest dates for threshold temperatures like 20 °C and 25 °C.
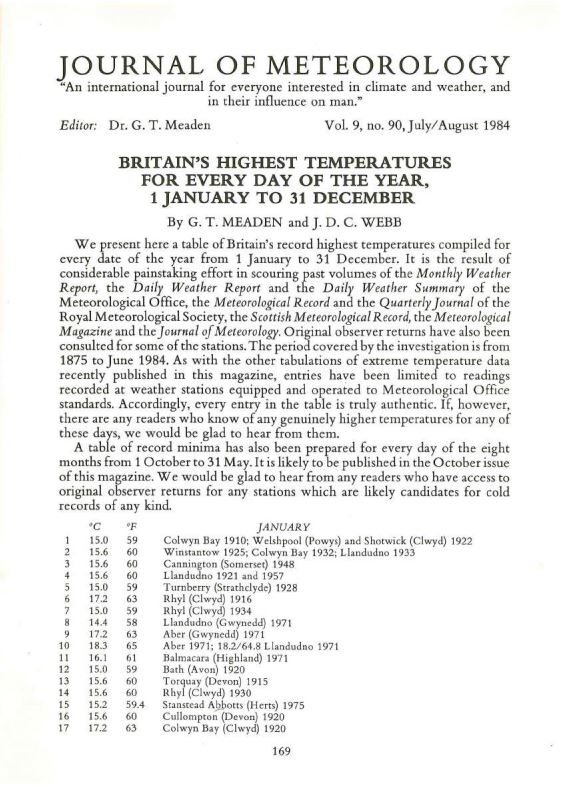
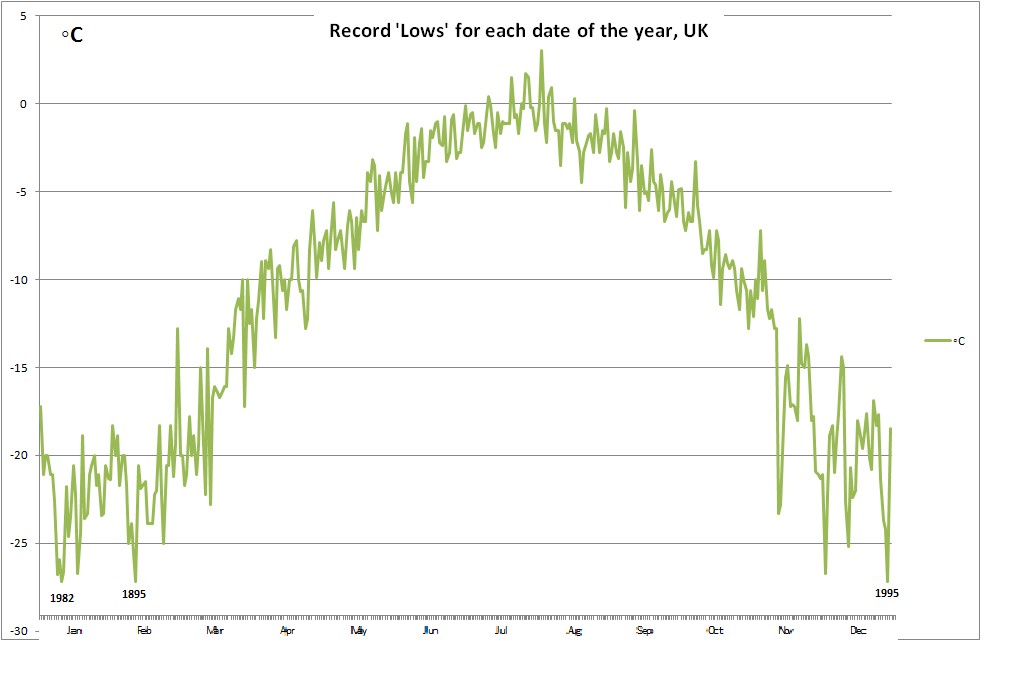
UK monthly temperature extremes were published in early issues of the Journal of Meteorology, which Dr Terence Meaden founded and edited from 1975 (in association with the TORnado and Storm Research Organisation - aka TORRO - which he also founded the previous year). This publication generated feedback on weather extremes from numerous readers. At least one reader commented that, when in the USA, they often heard references such as “the hottest July 1st on record”. Some subscribers had already been compiling their own notes on daily ‘highs’ and ‘lows’ from those published in the press; others had accessed local weather records from long-running stations. Contributors included the observer at Braemar, Aberdeenshire, where the UK lowest temperature record (recorded there in 1895) was equalled in January 1982. Braemar shares the UK record ‘low’ with Altnaharra in Sutherland which also recorded -27.2 °C in 1995.
All these contributions helped highlight specific years and dates for myself and Terence to painstakingly check as we began work on the list of UK Daily Temperature Records. Between 1980 and 1983, I had made extensive notes for an article on UK county extremes, and on finding out Terence had also been sourcing data for this, we merged our findings to produce full lists of county extremes for the December 1983 and March 1984 issues of the Journal of Metorology. Many notes from this exercise proved helpful in subsequently compiling the UK daily lists. Draft handwritten lists were exchanged several times between ourselves (and helpfully read through by some other journal contributors) before the first list of Britain's daily highest temperatures was published in the August 1984 edition of the Journal of Meteorology.
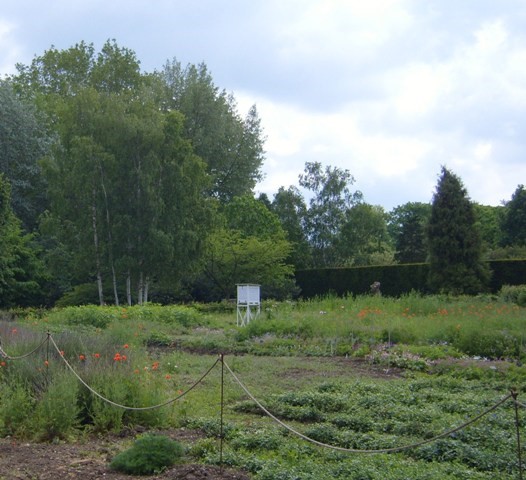
So far it all sounds simple and straightforward, but the practical reality of compiling a list of temperature extremes was certainly not. As already mentioned, some “record” temperature measurements didn’t meet certain standards, so had to be excluded. The first move towards standardising temperature observations actually occurred in 1873, when the (Royal) Meteorological Society concluded that the louvred Stevenson screen best fulfilled the requirements for a perfect thermometer exposure, and recommended its general use (with subsequent guidance to site away from the shelter of buildings). The screen was invented by Thomas Stevenson, a Scottish Lighthouse engineer (and father of author Robert Louis Stevenson).
When we started the project, there were no electronic devices (apart from pocket calculators) so researchers came ‘armed’ with notepads and lists of specific stations to check. The Met Office’s Monthly Weather Report (dating from 1884), which published extremes for a large number of accredited stations, proved an excellent starting point. Helpful data was sourced from the Met Office’s Daily Weather Reports, as well as authoritative articles in the Meteorological Magazine, Weather and the Journal of Meteorology. There were numerous visits to the National Meteorological Library and Archives, which were then in Bracknell, to find publications not available elsewhere or to peruse original manuscripts. There was so much interesting material in the Archives, that it was quite easy to get side-tracked!
The help and guidance given by the Met Office Library and Archives teams over the years has been much appreciated. In the pre-digital days, recent weather station data was also available on microfiche. More recently records have been increasingly digitised. Data for more than 50 years has been stored in the Met Office MIDAS dataset, available to researchers via BADC/CEDA (with markers indicating when readings have passed quality control). In addition, for many years, private weather stations published in the Climatological Observers Link Bulletin have been graded for instrumentation and exposure so as to indicate those operated to Met Office and WMO standards.
Quality control has indeed been important. The retrospective “Additions and corrections” published in the Monthly Weather Report needed to be checked. Maximum temperatures more than 2 °C above adjacent stations (at comparable altitudes) were treated with caution, pending sound explanation. However, low minimum temperatures can vary much more because of, for example, local topography. Peer review of the papers published in Weather in 1993 and 2000 were invaluable, as were written discussions with leading UK climatologists.
The extremes listed are limited to sites below 500 metres, as we have excluded ‘high-level’ weather stations that are not at permanently inhabited heights (such as the historic Ben Nevis Observatory and the more recent automatic station on Cairngorm). For comparison, the highest village in Britain is Flash, in the Staffordshire Peak District, at 463 m, while in Scotland the highest village is Wanlockhead, Dumfriesshire, at 444 m. County boundaries had to be checked carefully and ceremonial counties, rather than administrative counties, have subsequently been used as they are more likely to stay “set in stone”.
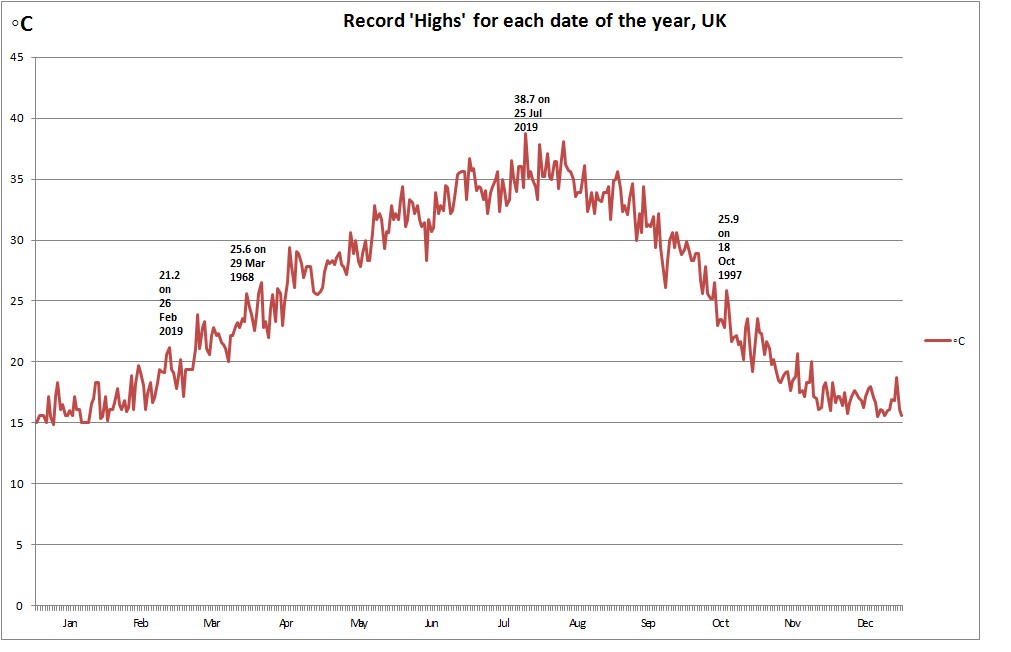
Some interesting facts that have been revealed by our lists of daily maximum and minimum temperatures in the UK:
- The only summer day that has never hit the magic 30 °C is 13 June.
- The Autumn equinox date of 22 September is also somewhat anomalous with the current record of 26 °C being well below the preceding or following days.
- The three hottest days in May have all occurred before 1950, and a 90 °F (32 °C) has not been recorded in May since 1947.
- The hottest September days occurred way back in 1906 and 1911, and only once in the past 70 years has 90 °F (32 °C) been reached in September – that was in 2016.
- The two warmest December temperatures, and the equal warmest January temperature, have occurred in northern Scotland, the latter shared with Bangor in North Wales. The sun has little power in the depths of winter, so the highest temperatures are the result of a Föhn (German name) or Foehn effect, where very mild south or south-westerly airstreams are warmed by (adiabatic) compression on descent from mountain ranges.
- Besides Scotland’s glens and the valleys of mid Wales, some of the lowest summer temperatures have occurred around the light, sandy soils of the Breckland on the Norfolk-Suffolk border.
- A curious British ‘heatwave’ occurred way back on 6 August 1910 when 28 °C was registered in the Shetland Isles, while nowhere elsewhere in the UK exceeded 20 °C. A pulse of warmth from Scandinavia just clipped the Northern Isles.
- The highest temperature of the year has been recorded as early as 14 May (in 1965) and as late as 27 September (1895).
- The most remarkable date records? A personal view would be the spooky warm high of 24 °C on 31 October (Halloween) in 2014, and a similar reading on 9 March 1948.
Recently, perhaps indicative of the warming trend, maximum temperature daily records have been quite a challenge to keep up to date! However, sharing of knowledge on online forums (including the TORRO forum) has been helpful in recent updates.
An interesting point regarding the Celsius (Centigrade) and Fahrenheit temperature scales is that the readings of 0 degrees and 100 degrees on the Fahrenheit scale correspond very closely to the absolute recorded extremes in some of the populated areas of the UK The longest UK site record, at Oxford (over 200 years), has an extreme ‘low’ of exactly 0 °F (-17.8 °C) and an extreme high of 98 °F (36.5 °C). This may partly explain why the ‘old money’ scale continues to be referred to in some British conversations!
The current list of extremes can be found on the TORRO web site.
An appendix to the 2016 TORRO book gives further details and useful references to several key articles on historic and recent extremes.
About the author
Jonathan Webb has enjoyed a huge interest in the skies and weather from an early age. He is Thunderstorm research director of the Tornado and Storm Research Organisation (TORRO), having joined the TORRO team in 1985. He has also been a member of the Royal Meteorological Society since 1982 and recently served five years on the Editorial board of Weather. His published research includes case studies of thunderstorm episodes and associated severe convective weather, and also summaries and analyses of the TORRO research databases of hailstorms and lightning damage. He has also contributed to published research on temperature and precipitation extremes in the United Kingdom.

")

