
State of the UK Climate 2021
The latest annual report shows the continuation of warmer than average years and an increasing rate of sea level rise around the UK.

The State of the UK Climate 2021 report reviews the climate and significant meteorological events of the year across the UK. This year’s report continues to show the impact of global temperature rises on the climate in the UK, reaffirming that climate change is not just a problem for the future and that it is already influencing the conditions we experience here at home.
Temperature
In what was in some regards a relatively unremarkable year in the UK’s climatology, the maximum temperature recorded in 2021 was 32.2°C. Compared to years from recent decades this was a relatively low peak temperature, but is still considerably warmer than the average hottest day of the year for the period 1961-1990 of 31.4°C.
In a changing climate we expect variability from year-to-year, but cooler conditions of today are warm relative to past climates, as indicated in the annual mean temperature graph below. While the year 2021 would be considered near normal compared to the last three decades, before 1990 a year like this would be the second warmest in our national series that began in 1884.
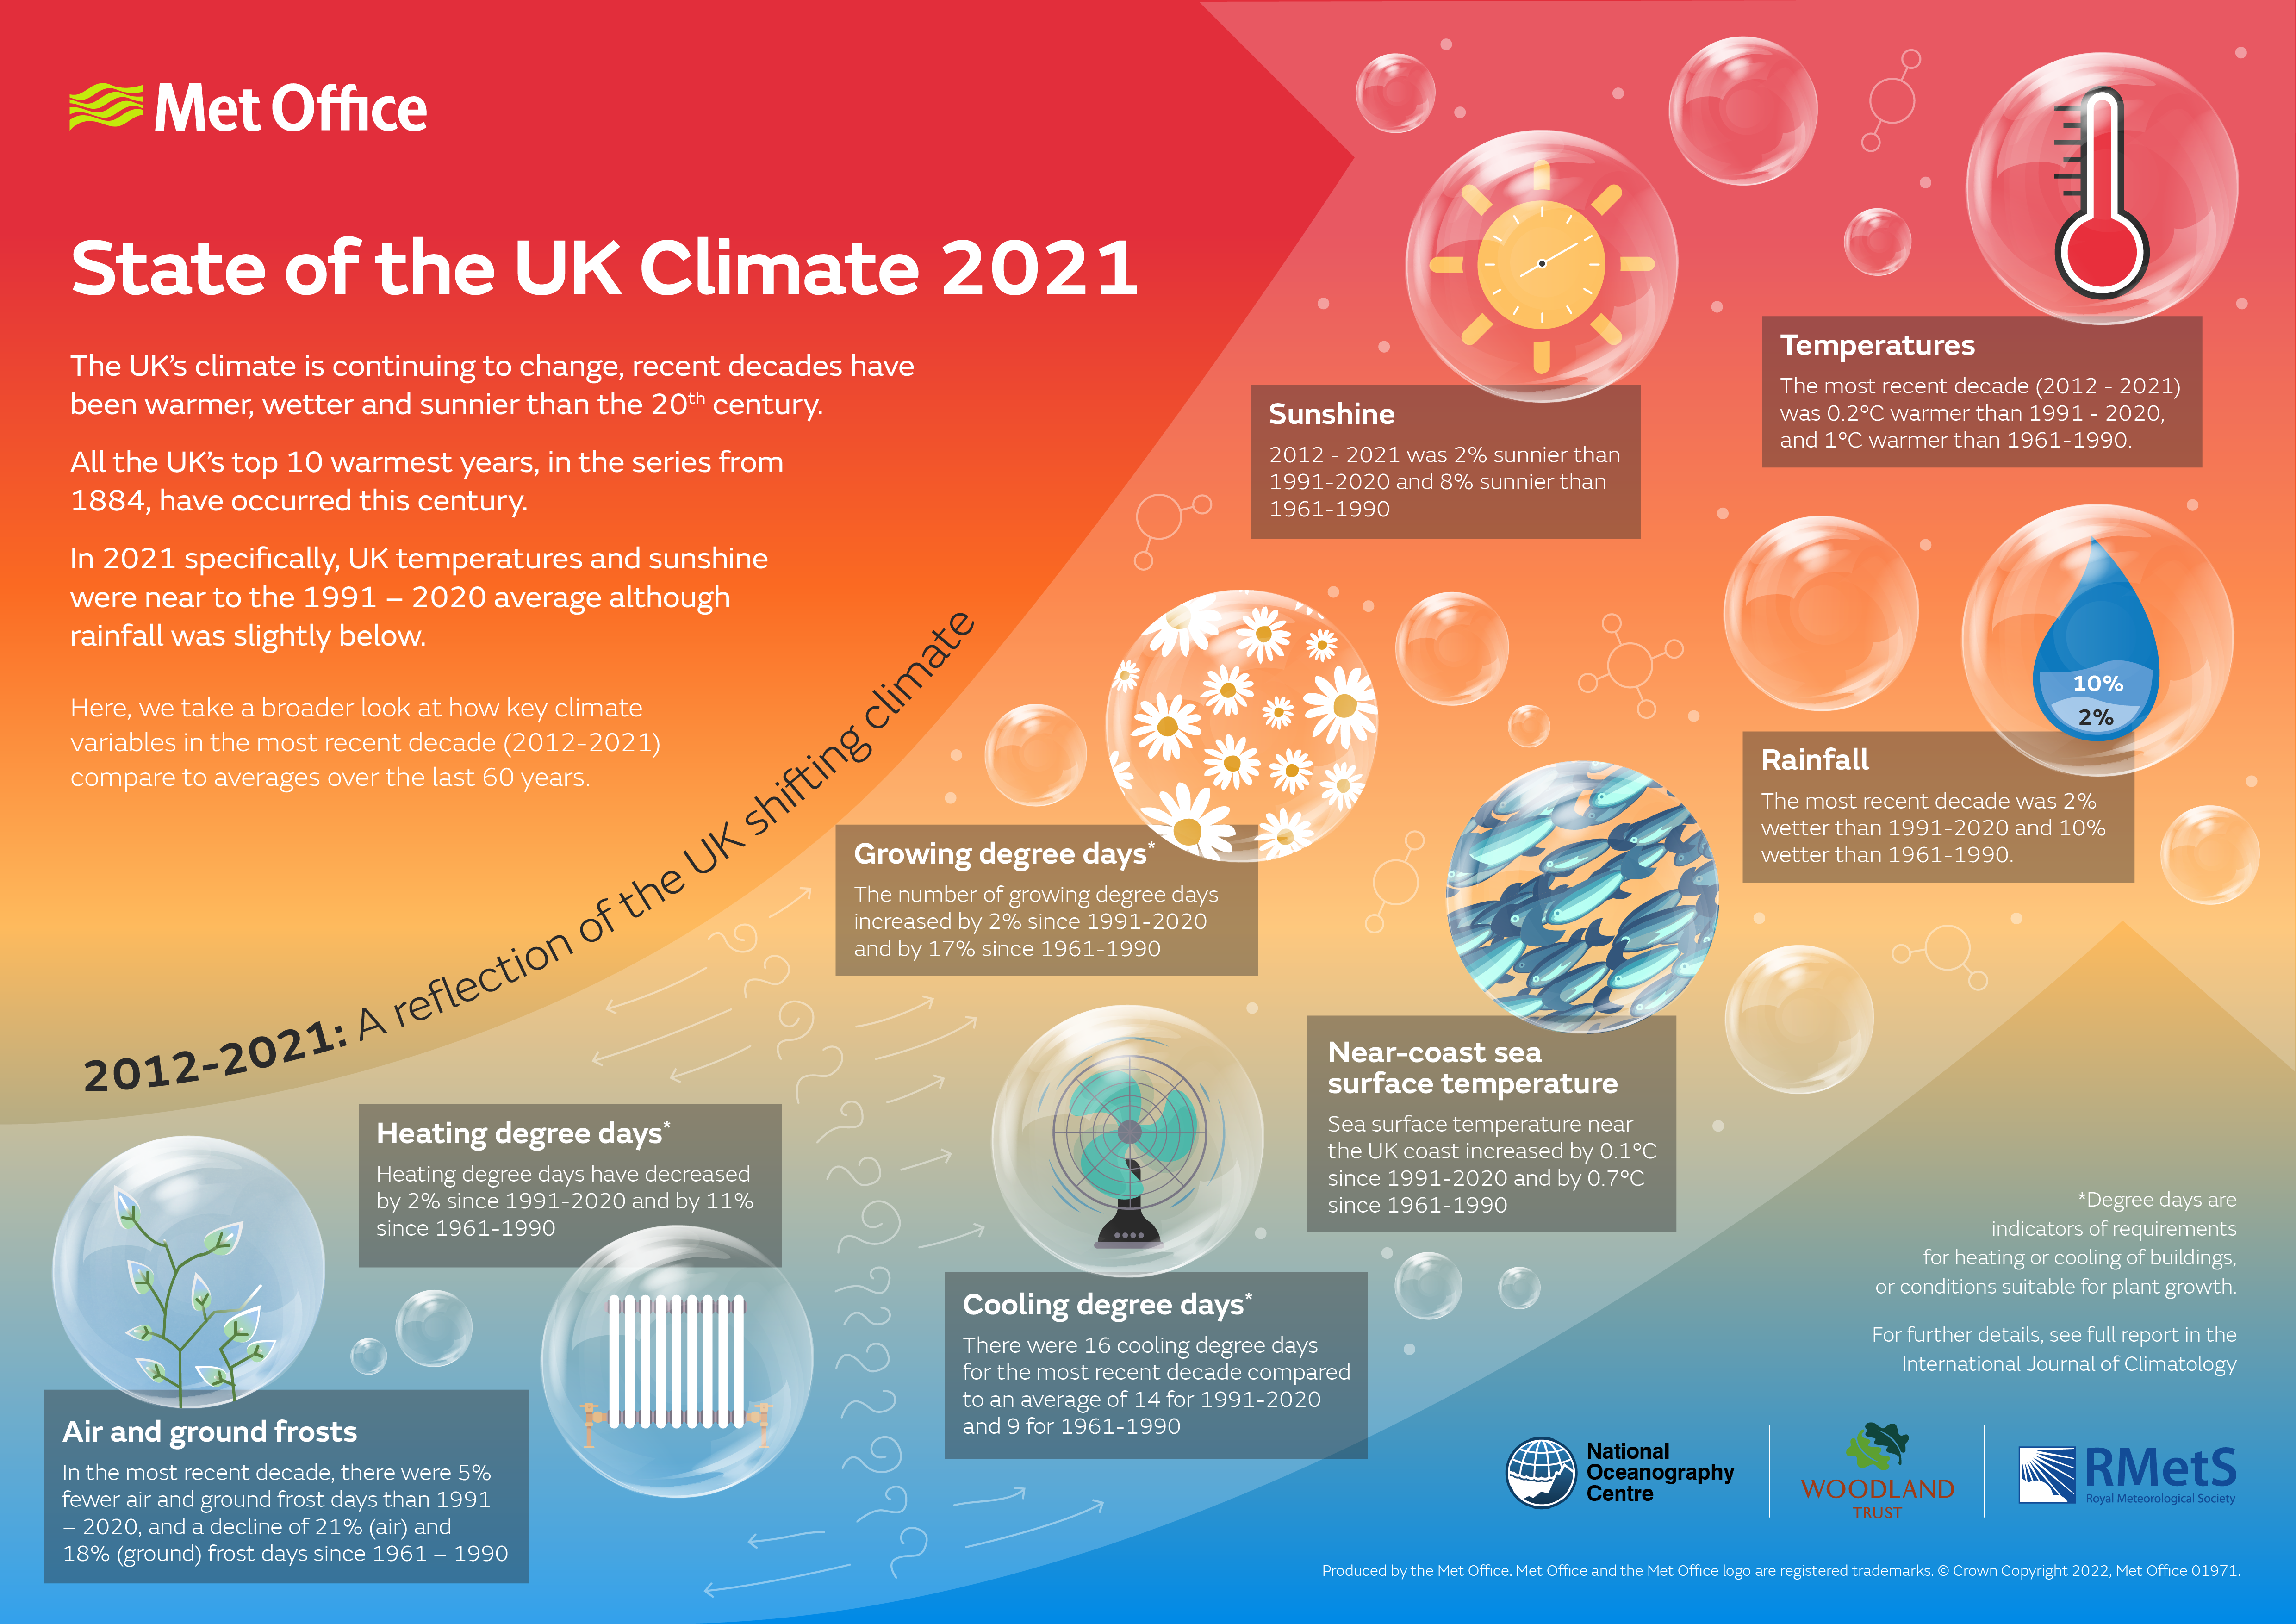
Winter and spring were both near-normal compared to the climate of a few decades ago (1961-1990) but summer and autumn were much warmer (+1.5°C, +1.8°C). The UK continues to warm on a rate broadly consistent with, but slightly higher than, global temperature increases, with the most recent decade 1.0°C warmer than the 1961-1990 climate period. 2021 was the UK’s 18th warmest year in a series dating back to 1884.
Mike Kendon, from the Met Office National Climate Information Centre, said:
“As ever the weather we experienced in 2021 was highly variable, with extreme events like Storm Arwen bringing impacts to our daily lives. When considering the UK climate over the whole year it might seem rather unremarkable, however it is telling that whereas we consider 2021 as near-average for temperature in the context of the current climate, had this occurred just over three decades ago it would have been one of the UK’s warmest years on record.
“Although 1°C of warming might not sound like much, it has led to maximum temperatures like the 32.2°C we saw in 2021 becoming routine rather than the exception. This is particularly stark when considering the record breaking heat the UK experienced just last week.”
The report details notable weather events from 2021, putting them into the context of the UK’s climate. Events such as Storm Arwen in November, Storm Darcy in February, a new Northern Ireland temperature record in July and exceptional rain in October are all reviewed.
Sea level
Since the 1900s sea level has risen around the UK by around 16.5cm. This new report outlines how the rate of sea level rise around the UK is in fact increasing. While the rate of increase was 1.5mm each year in the early part of last century, over the past 30 years the rates of increase have risen to 3.0-5.2mm each year depending on location around the UK. As the sea level rises around the UK it exposes more areas of coastal land to larger and more frequent storm surges and wind driven wave impacts.
Dr Svetlana Jevrejeva from the National Oceanographic Centre said:
“Tide gauge records provide robust observational evidence that sea level around the UK continue to rise due to increased rate of ice loss from the Greenland and Antarctic ice sheets, as well as continued glacier mass loss and warming of the ocean. Our long term records show that over the past few decades rate of sea level rise in the UK is increasing. As sea levels rise there can be greater impacts from storm surges. Last year storm surges of over 1.5 m were seen during Storm Arwen, but extreme sea levels were avoided as this occurred during low water and a neap tide”.
Phenology
First leaf dates in the UK were impacted by a cold April. The average April Central England Temperature (CET) was lower than that in March; a phenomenon which has only occurred 15 times in the 363 years of the CET series. Species that normally leaf earlier in the season (such as Elder) were even earlier, whereas those that normally leaf later in the spring were delayed; for example Oak first leaf dates were delayed by nearly four days. Weather related delays in the natural timing of these events can have further impacts on interactions with other species later in season. A warm October meant the average bare tree date was delayed across all monitored species.
Professor Tim Sparks, Expert Volunteer for the Woodland Trust, said:
“Phenology in spring closely mirrors the prevailing temperature, and we have seen long term changes. However, the response to these cues can vary between species and we don't fully understand the complexities of this and the impact on our future environment.”
Importance of climate monitoring
Prof Liz Bentley, Chief Executive of the Royal Meteorological Society, said:
“This report is the authoritative annual summary of the UK climate published as a special supplement in our International Journal of Climatology. It not only helps to highlight the latest knowledge on our changing climate but also enables us to understand the trends, risks and impacts to help inform how we will need to adapt, now and in the future.
“This important report published in an international, peer-reviewed journal, available in over 8,600 academic and research organisations, will ensure a permanent record and support other scientific studies. It is also increasingly important to use this report to help update government, businesses, and the broader public about the reality of the changes in our climate and the impacts.”
The State of the UK Climate reports have examined the changing climatology of the UK each year and been published in the International Journal of Climatology since 2017.
You can view previous editions of the report on a dedicated webpage.

