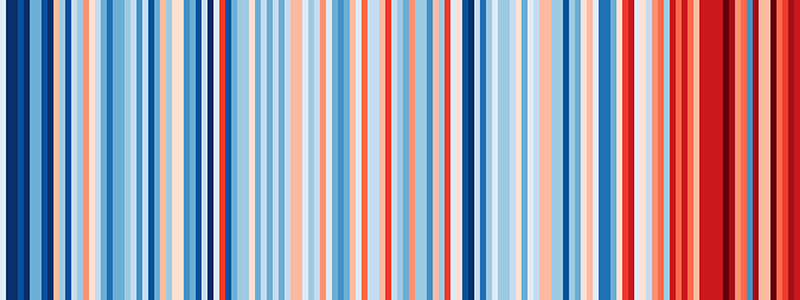

Warming Stripes show the changing climate across the globe
To communicate scientific facts, numbers and graphs are not always needed. The ‘warming stripe’ graphics, developed by Climate Scientist and Society Fellow, Professor Ed Hawkins (University of Reading), are a visual representation of temperature change over the past decades. For the graphic shown here, each stripe depicts the average yearly temperature for the UK from 1884 to 2018. The average baseline value for determining the colour of each stripe - i.e. either shades of red (warmer) or blue (colder) - refers to the period 1971-2000.
The graphics show this important information at a glance and are kept as simple as possible. On the website https://showyourstripes.info, you can generate similar graphics for countries across the world. The graphics are free to use, and have been printed on mugs, scarfs, badges and ties to raise awareness.
Today, at summer solstice, meteorologists around the world display the warming stripes on live TV to promote awareness of climate change.

