
An introduction to remote sensing
Satellites for observing the Earth’s surface have been used since the 70s and have advanced our understanding of science. Using satellites allows us to observe and detect changes in the Earth’s most remote regions. The first land cover satellite, Landsat 1, was launched by the United States on 23 July 1972. This mission and many more have continued providing an enormous collection of satellite imagery. According to the United Nations Office for Outer Space Affairs (UNOOSA), almost 600 earth observation satellites are currently in orbit around our planet – operated by various countries and fulfilling different tasks. This article will introduce remote sensing, covering the electromagnetic spectrum, active and passive satellite systems, types of resolution that need to be considered and open access satellite depositories.
The Electromagnetic Spectrum
Satellite sensors detect emitted or reflected energy from the Earth’s surface. This energy or electromagnetic radiation is often expressed in frequency (Hz) or wavelength (λ). The following image shows the range of waves, including long wavelengths such as microwaves or broadcast radio waves and short wavelengths such as gamma or x-rays. The spectrum also includes the visible spectrum, which we can see with our eyes. This fraction is tiny compared to the large range of wavelengths. Some gases in the atmosphere (carbon dioxide, water vapour and ozone) absorb energy at specific wavelengths, which constrains the wavelength ranges that can be used for remote sensing. The regions of the spectrum where electromagnetic energy can travel through the atmosphere are called “atmospheric windows”, and this is where satellite sensors operate.
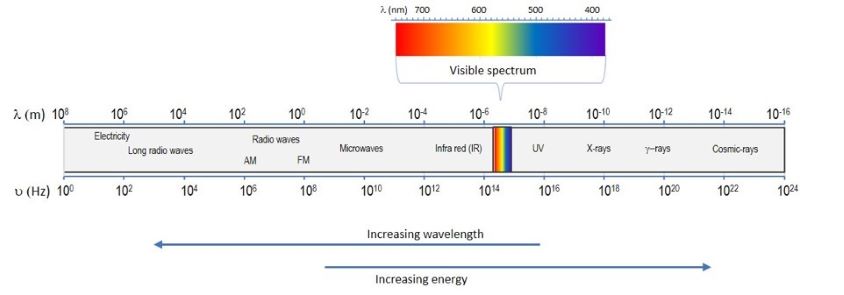
Electromagnetic Spectrum, Credit: Engineering ToolBox, (2016). [Accessed 30 July 2018]
Active and Passive Satellites
Satellite sensors can work in two different ways: active and passive. Active systems illuminate the area of interest and measure the reflected or backscattered wavelength from the surface. Active systems mostly use the microwave region of the electromagnetic spectrum. They are independent of weather conditions and can also operate during nighttime. In contrast, passive sensors use the sun as an illumination source and measure the energy naturally emitted from the Earth’s surface. Most passive systems require a clear sky and daylight to operate. During the nighttime, thermal energy can be recorded when the signal is strong enough.
Different surfaces of the Earth, for example, bare soil, vegetation or water bodies, have a “spectral signature”. This is because the sun’s energy reaches the surface and is then absorbed, transmitted or reflected by the material in certain regions of the spectrum. Satellite sensors are tuned to detect the reflected energy. The near-infrared region is, for example, very suitable for detecting how healthy or unhealthy vegetation is, and the ultraviolet (UV) region allows to distinguish rocks and minerals.
Resolutions
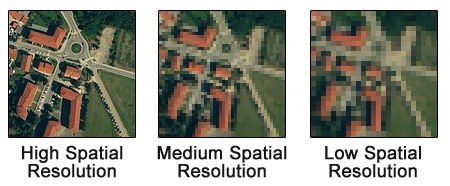
All satellite sensors have their strengths and weaknesses and are helpful for different problems. We distinguish between spatial, temporal and spectral and radiometric resolution of sensors. (1) Spatial resolution refers to the smallest possible detail that the sensor can capture. A high spatial resolution is required when for example, detecting separate houses. It is commonly expressed in metres – a spatial resolution of 30 m will result in pixel sizes, which are 30 x 30 m.
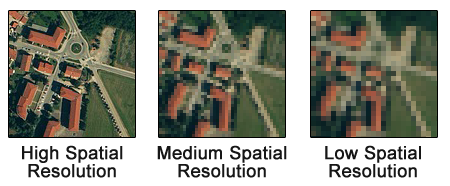
Illustration of high, medium and low spatial resolution. Credit: GIS Geography
(2) Temporal resolution describes how often the sensor will revisit the same object and is often reported in days. For example, the Landsat satellite will pass by the location every 16 days in its orbit, while the SPOT satellite can revisit a location every 1 to 4 days. For example, a high temporal resolution is needed when mapping the impacts of an extreme weather event, for example, how flooding impacts a region over several days. Monitoring changes in vegetation over the summer require a lower temporal resolution. (3) Radiometric resolution refers to the ability of the sensor to detect grey-scale values. It is reported in bit. The higher the bit value of an image, the more variation in reflection is captured, and the larger the image. Finally, (4) spectral resolution means the width within the electromagnetic spectrum in which a sensor records information. High spectral resolution describes a narrow wavelength range. For example, multi-spectral satellite systems such as Landsat detect several discrete bands (3 to 10) at different wavelength intervals. Hyperspectral instruments can consist of hundreds or thousands of narrow bands. This high spectral resolution is useful when a fine discrimination, for example, between minerals or vegetation species, is needed.
Image Processing
Every satellite image consists of several bands or channels, each representing different wavelength intervals. Satellite images can be displayed as a “true colour composite”, which is precisely how we would see the Earth with our eyes. Similar to raw images from a DSLR, the channels red, green and blue of the visible spectrum are used for that. To visualise multi-spectral images, image processing software allows to display other human invisible wavelengths such as red, green or blue. This is called a “false colour composite”.
The following snapshot of Iran shows a true colour composite on the left and a false colour composite on the right. In the false colour composite, red represents shortwave infrared; green represents the near-infrared, and blue represents green. Take a look at the image and compare both. The shortwave infrared helps to distinguish wet from dry areas. You may notice the red colour along the dark ridges on the western edge of the image. This represents water flowing down the ridges, which would be invisible in the natural colour composition. This false colour composition makes it much easier to distinguish between different rock layers and formations. The green shading throughout the image is not representing vegetation but is due to the spectral signature of a particular rock. Detailed knowledge of the spectral signature of the Earth’s surface is required to allow an informed interpretation of satellite imagery. Scientists also collect “ground truthing” data in the field with handheld spectrometers to identify spectral signatures specific to a material (for example, a mineral) to support their interpretations.
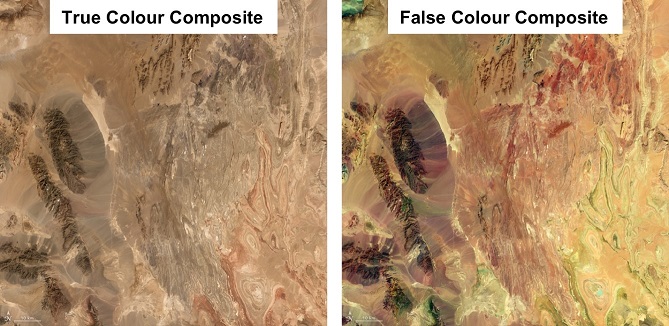
True and false colour composites of the Yazd and South Khorasan provinces of Iran based on Landsat-8 imagery. Credit: Visible Earth, NASA
Sometimes, satellite images can be stunning or even seem artistic, like the following image capturing the Lena River delta in northern Russia by the Landsat-7 satellite. The false colour composite is composed of near-infrared (red), shortwave infrared (green) and red (blue).
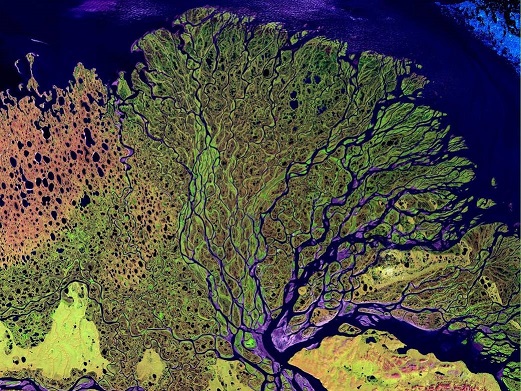
Lena River Delta, Russia acquired by Landsat-7. Credit: NASA
A lot of satellite imagery is freely available to the public. For example, the USGS’s database Earth Explorer provides access to the 40 years archive of the Landsat mission, digital elevation models and many more products of NASA’s missions. The European Space Agency (ESA) also launched their Copernicus Open Access Hub, providing access to imagery from the Sentinel mission.


