State of the Climate Report for the UK Energy Sector 2024-25
The State of the Climate for the UK Energy Sector report explores the impact of weather on the UK energy sector between 1 April 2024 and 31 March 2025, focusing on:
- Weather impacts on supply and demand.
- Weather impacts on energy infrastructure.
Key points
- Throughout November 2024, prolonged cold, calm and cloudy conditions led to high electricity demand and low renewable supply, increasing electricity prices across the month.
- On 8 January 2025, extreme low winds and simultaneous cold temperatures led to a large spike in the average daily real-time electricity price. Similar conditions on 20 January also led to a smaller increase in real-time price.
- Throughout August 2024, significant amounts of wind power in Scotland had to be curtailed due to high wind power production, increasing balancing costs.
- Storms Darragh and Éowyn impacted electrical infrastructure – disconnecting over 3 million customers between them – through strong winds and flooding from heavy rainfall.
- Whilst Éowyn was a stronger storm, Darragh caused more damage to the energy sector, as its path was over populated areas of Wales, and central and northern England.
- Lightning caused a large number of electricity faults in May and September 2024, particularly in Southern England.
Weather impacts on electricity supply and demand in 2024-25
Renewable electricity generation is weather-dependent:
- Wind power generation depends on wind speed, with low speeds reducing production, and turbines cutting out above a maximum operating speed.
- Solar generation depends on cloudiness, with cloudy days decreasing production.
Temperature is the primary driver of energy demand:
- In winter, low temperatures increase electricity demand.
- In summer, high temperatures increase electricity demand.
To combine these factors, the energy sector analyses a metric called 'demand-net-renewables': the total electricity demand left, after all renewable supply has been used up. This is the extra demand which must be met using gas turbines or other 'flexible' sources of electricity, compared to normal.
The figures below use real electricity price data and modelled demand, wind power generation and demand-net-renewables. These are presented as 'anomalies', showing whether each variable was higher or lower than normal for that time of year.
Winter
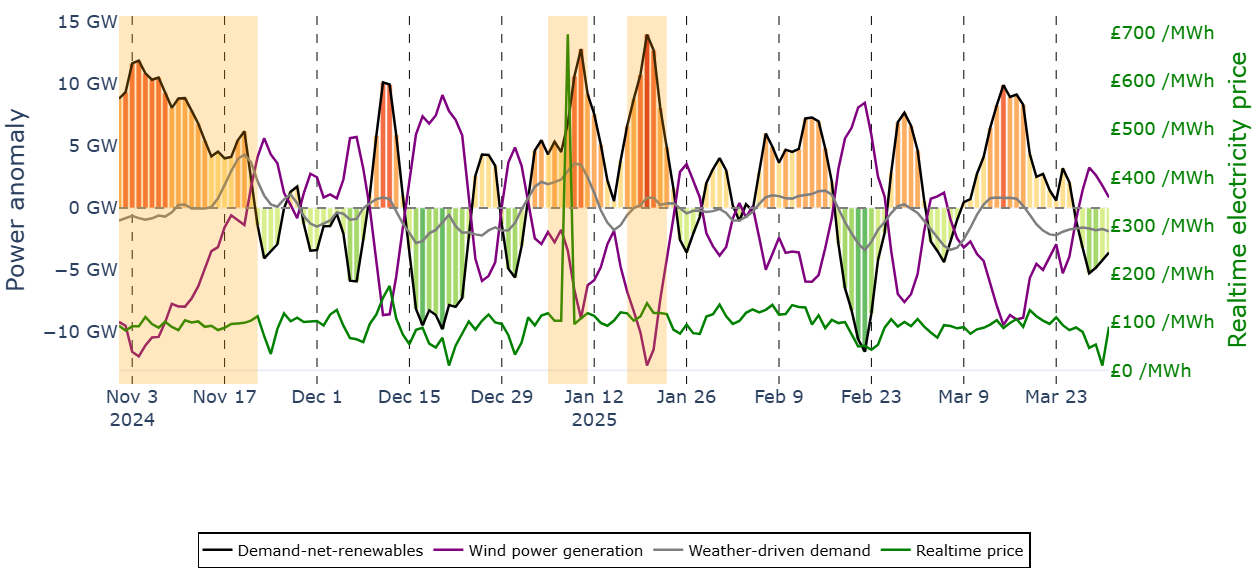
Caption: Demand-net-renewables, wind power production, weather-driven demand, day-ahead electricity price and real time electricity price, for 1 November 2024 - 31 March 2025. All are five-day rolling averages, except realtime price, which is daily average. See report for full methodology.
Weather data source: Hannah Bloomfield. Price data source: Electric Insights.
In winter, electricity prices are increased when there is a shortfall of energy supply relative to demand. This extra demand must be met by turning on extra generation, usually gas turbines, or by importing additional electricity from abroad, both of which result in higher prices.
These periods can be seen as peaks in demand-net-renewables and day-ahead prices.
In 2024-25, there were several periods of high demand-net-renewables anomalies:
- An extended calm, cloudy and cold period in November 2024, which kept day-ahead electricity prices above the 2024-25 winter average for most of the month.
- Two days in January with extremely low wind speeds and cold temperatures, which led to extreme daily average real time price spikes – to over 7 times the 2024-25 winter average on 8 January.
Summer
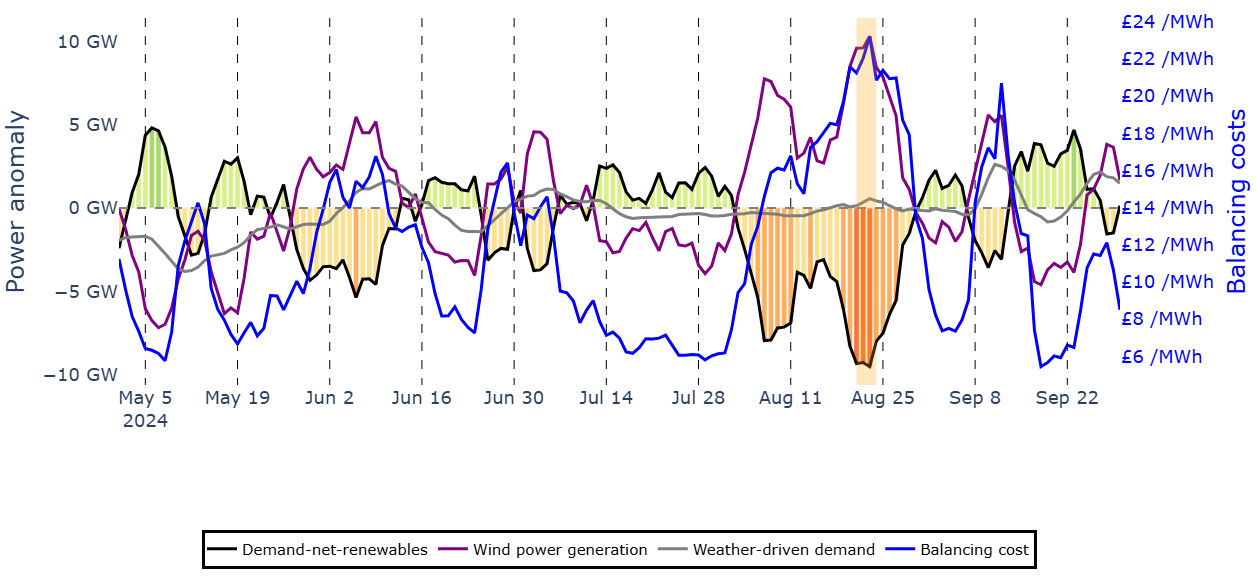
Caption: Demand-net-renewables, wind power production, weather-driven demand, and system balancing costs, for 1 May 2024 - 30 September 2024. All are five-day rolling averages. See report for full methodology.
Weather data source: Hannah Bloomfield. Price data source: Electric Insights.
In summer, electricity demand is generally low. When wind and solar generation are high, power production may be greater than electricity demand. At these times, renewable energy producers are sometimes paid to reduce their power production ('curtailment') to maintain balanced supply and demand. If the grid is congested, for example if there is not enough capacity to transport power produced in Scottish wind farms to demand centres in southern England, gas power plants may need to be turned on. These additional costs are incorporated into grid 'balancing costs'.
These periods can be seen as troughs in demand-net-renewables and peaks in balancing costs.
In August 2024, there were several periods with significant curtailment which increased electricity prices. Throughout August, balancing costs were 44% higher than the summer average, reaching 93% higher on 22 August.
Weather impacts on energy infrastructure in 2024-25
Extreme weather can cause damage to energy infrastructure. In the UK, the biggest impacts come from:
- High winds, which can damage power lines directly, or cause trees to fall onto them.
- Flooding (from river overflow, coastal flooding or heavy rainfall), which can affect low-lying substations and power generation plants.
- Lightning, which can cause damaging voltage surges on power lines without adequate protection.
- Extreme heat, which can cause overheating and dangerous sagging of power lines.
The risk to the energy sector is determined by:
- The event's severity: more severe extremes cause more power cuts.
- The exposure to the extreme: extremes in more populated areas cause more disconnections.
- The vulnerability of assets: more adapted infrastructure has higher resilience.
The sector already has many physical and operational measures in place to reduce energy infrastructure's vulnerability, including raising equipment above the ground to protect it from flooding, and deploying extra engineers during storms to fix faults quickly. Exposure is set by an asset's location. Severity is determined by how extreme the weather is.
Distribution Network Operators (DNOs) are responsible for running and maintaining the power lines that get electricity from the National Grid to homes and businesses. The figures below use data from DNOs on the number of customers experiencing power cuts ('disconnected') at a given time. Each disconnection is linked to a cause, which includes weather-related causes.
Faults linked to wind and precipitation are shown, along with weather data at that time.
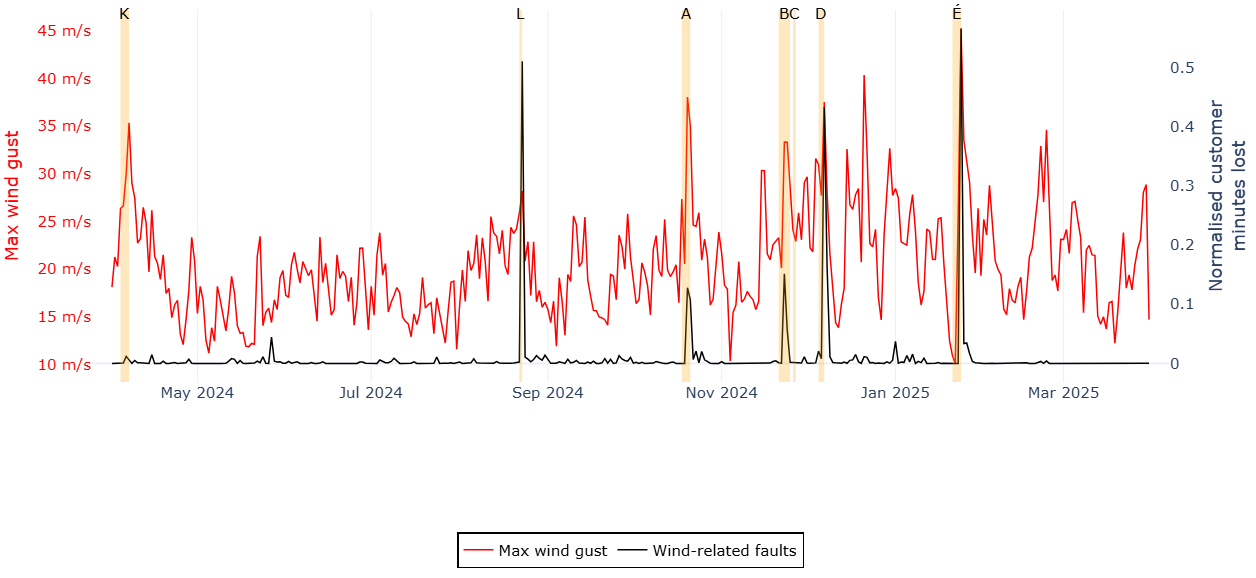
Caption: Maximum wind gusts across GB and wind-related faults (as normalised customer minutes lost) in the electricity network, for 1 April 2024 - 31 March 2025. Named storms are highlighted. See report for full methodology.
Weather data source: ERA5. Fault data sources: SSEN, SPEN, ENWL, NPG.
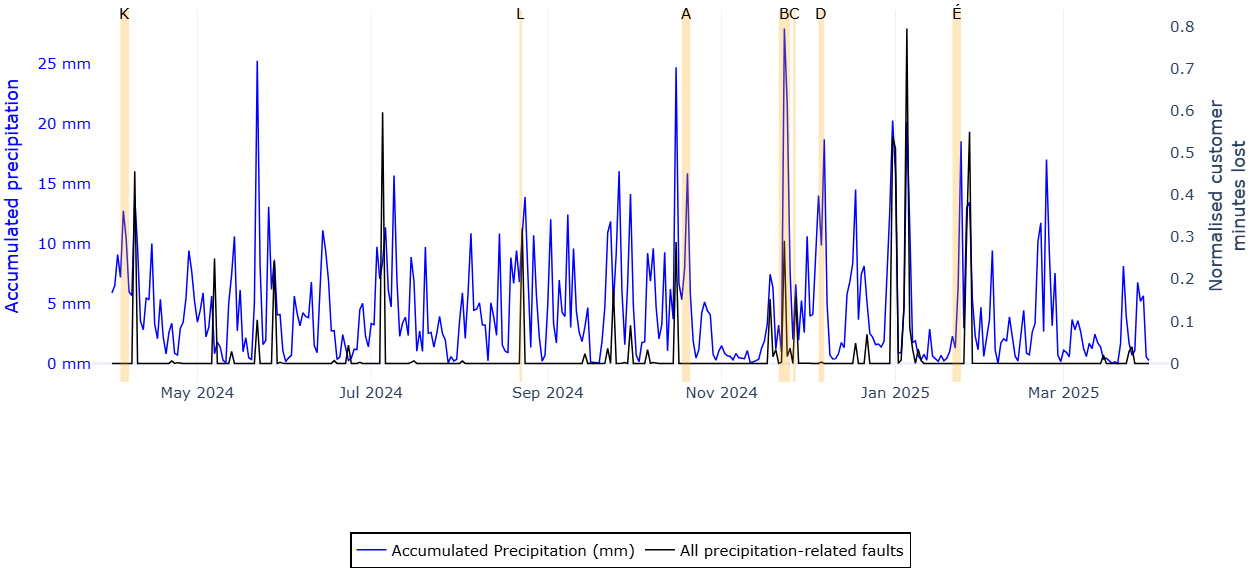
Caption: 72hr accumulated GB precipitation and precipitation-related faults (as normalised customer minutes lost) in the electricity network, for 1 April 2024 - 31 March 2025. Named storms are highlighted. See report for full methodology.
Weather data source: ERA5. Fault data sources: SSEN, SPEN, ENWL, NPG.
There is a clear link between the strength of wind gusts and wind-related outages: stronger winds lead to more power cuts. The relationship between accumulated precipitation and precipitation-related faults is more complex, because very extreme rainfall is needed to cause significant flooding, and other factors like the surface (e.g., soil vs. concrete), location of the rainfall and previous weather impacts are all important and can impact whether flooding occurs.
As can be seen in the figures above, in 2024-25, the most damaging storms on the electricity network were:
- Storm Darragh (6-7 December 2024), which brought wind speeds of up to 96 mph and rainfall of up to 100mm in 72 hours, particularly affecting populated areas of Wales, and central and northern England. This caused over 2.3 million customers to lose power.
- Storm Éowyn (24 January 2025) was the UK's 'most powerful wind storm for over a decade', but its track over Scotland and northern England meant the impact on the electricity network was not as severe as Darragh. Over 1 million customers suffered outages, and the time taken to reconnect customers was longer due to prolonged high winds hampering recovery efforts.
Lightning was also a major cause of faults in 2024-25. Lightning strikes can cause surges, which damage equipment if lightning management systems are unable to cope. The relationship between lightning density and outages is quite complex: a single lightning strike which hits critical energy infrastructure can cause many outages, whilst many strikes elsewhere may cause none.
May and September 2024 experienced higher lightning strike densities than average, particularly in the south of the UK, which were associated with increased lightning-related electricity system faults.
What can we learn from the weather in 2024-25?
We also modelled what would happen if 2024-25's weather happened in a projected 2050 power system, which includes significantly more wind and solar power, and increased energy demand. Large scale renewable energy droughts where demand far exceeds the generation from renewable sources such as solar and wind, like those identified in November 2024 and January 2025, would still exist in the projected future power system despite the additional wind and solar generation capacity. Careful consideration is therefore necessary when planning a future electricity network to ensure that additional renewable sources are integrated effectively to ensure a clean, resilient energy system.
There are many open questions around how climate change will impact the frequency and severity of calm, cold conditions, and how best to design a future energy system to mitigate the risks of these conditions. These areas are the subject of ongoing research in the energy-meteorology community.
State of the Climate Report for the UK Energy Sector 2024-25
The State of the Climate for the UK Energy Sector report explores the impact of weather on the UK energy sector between 1 April 2024 and 31 March 2025, focusing on:
- Weather impacts on supply and demand.
- Weather impacts on energy infrastructure.
Key points
- Throughout November 2024, prolonged cold, calm and cloudy conditions led to high electricity demand and low renewable supply, increasing electricity prices across the month.
- On 8 January 2025, extreme low winds and simultaneous cold temperatures led to a large spike in the average daily real-time electricity price. Similar conditions on 20 January also led to a smaller increase in real-time price.
- Throughout August 2024, significant amounts of wind power in Scotland had to be curtailed due to high wind power production, increasing balancing costs.
- Storms Darragh and Éowyn impacted electrical infrastructure – disconnecting over 3 million customers between them – through strong winds and flooding from heavy rainfall.
- Whilst Éowyn was a stronger storm, Darragh caused more damage to the energy sector, as its path was over populated areas of Wales, and central and northern England.
- Lightning caused a large number of electricity faults in May and September 2024, particularly in Southern England.
Weather impacts on electricity supply and demand in 2024-25
Renewable electricity generation is weather-dependent:
- Wind power generation depends on wind speed, with low speeds reducing production, and turbines cutting out above a maximum operating speed.
- Solar generation depends on cloudiness, with cloudy days decreasing production.
Temperature is the primary driver of energy demand:
- In winter, low temperatures increase electricity demand.
- In summer, high temperatures increase electricity demand.
To combine these factors, the energy sector analyses a metric called 'demand-net-renewables': the total electricity demand left, after all renewable supply has been used up. This is the extra demand which must be met using gas turbines or other 'flexible' sources of electricity, compared to normal.
The figures below use real electricity price data and modelled demand, wind power generation and demand-net-renewables. These are presented as 'anomalies', showing whether each variable was higher or lower than normal for that time of year.
Winter
Caption: Demand-net-renewables, wind power production, weather-driven demand, day-ahead electricity price and real time electricity price, for 1 November 2024 - 31 March 2025. All are five-day rolling averages, except realtime price, which is daily average. See report for full methodology. To view the interactive version of this chart, please access the report on a desktop computer.
Weather data source: Hannah Bloomfield. Price data source: Electric Insights.
In winter, electricity prices are increased when there is a shortfall of energy supply relative to demand. This extra demand must be met by turning on extra generation, usually gas turbines, or by importing additional electricity from abroad, both of which result in higher prices.
These periods can be seen as peaks in demand-net-renewables and day-ahead prices.
In 2024-25, there were several periods of high demand-net-renewables anomalies:
- An extended calm, cloudy and cold period in November 2024, which kept day-ahead electricity prices above the 2024-25 winter average for most of the month.
- Two days in January with extremely low wind speeds and cold temperatures, which led to extreme daily average real time price spikes – to over 7 times the 2024-25 winter average on 8 January.
Summer
Caption: Demand-net-renewables, wind power production, weather-driven demand, and system balancing costs, for 1 May 2024 - 30 September 2024. All are five-day rolling averages. See report for full methodology. To view the interactive version of this chart, please access the report on a desktop computer.
Weather data source: Hannah Bloomfield. Price data source: Electric Insights.
In summer, electricity demand is generally low. When wind and solar generation are high, power production may be greater than electricity demand. At these times, renewable energy producers are sometimes paid to reduce their power production ('curtailment') to maintain balanced supply and demand. If the grid is congested, for example if there is not enough capacity to transport power produced in Scottish wind farms to demand centres in southern England, gas power plants may need to be turned on. These additional costs are incorporated into grid 'balancing costs'.
These periods can be seen as troughs in demand-net-renewables and peaks in balancing costs.
In August 2024, there were several periods with significant curtailment which increased electricity prices. Throughout August, balancing costs were 44% higher than the summer average, reaching 93% higher on 22 August.
Weather impacts on energy infrastructure in 2024-25
Extreme weather can cause damage to energy infrastructure. In the UK, the biggest impacts come from:
- High winds, which can damage power lines directly, or cause trees to fall onto them.
- Flooding (from river overflow, coastal flooding or heavy rainfall), which can affect low-lying substations and power generation plants.
- Lightning, which can cause damaging voltage surges on power lines without adequate protection.
- Extreme heat, which can cause overheating and dangerous sagging of power lines.
The risk to the energy sector is determined by:
- The event's severity: more severe extremes cause more power cuts.
- The exposure to the extreme: extremes in more populated areas cause more disconnections.
- The vulnerability of assets: more adapted infrastructure has higher resilience.
The sector already has many physical and operational measures in place to reduce energy infrastructure's vulnerability, including raising equipment above the ground to protect it from flooding, and deploying extra engineers during storms to fix faults quickly. Exposure is set by an asset's location. Severity is determined by how extreme the weather is.
Distribution Network Operators (DNOs) are responsible for running and maintaining the power lines that get electricity from the National Grid to homes and businesses. The figures below use data from DNOs on the number of customers experiencing power cuts ('disconnected') at a given time. Each disconnection is linked to a cause, which includes weather-related causes.
Faults linked to wind and precipitation are shown, along with weather data at that time.
Caption: Maximum wind gusts across GB and wind-related faults (as normalised customer minutes lost) in the electricity network, for 1 April 2024 - 31 March 2025. Named storms are highlighted. See report for full methodology. To view the interactive version of this chart, please access the report on a desktop computer.
Weather data source: ERA5. Fault data sources: SSEN, SPEN, ENWL, NPG.
Caption: 72hr accumulated GB precipitation and precipitation-related faults (as normalised customer minutes lost) in the electricity network, for 1 April 2024 - 31 March 2025. Named storms are highlighted. See report for full methodology. To view the interactive version of this chart, please access the report on a desktop computer.
Weather data source: ERA5. Fault data sources: SSEN, SPEN, ENWL, NPG.
There is a clear link between the strength of wind gusts and wind-related outages: stronger winds lead to more power cuts. The relationship between accumulated precipitation and precipitation-related faults is more complex, because very extreme rainfall is needed to cause significant flooding, and other factors like the surface (e.g., soil vs. concrete), location of the rainfall and previous weather impacts are all important and can impact whether flooding occurs.
As can be seen in the figures above, in 2024-25, the most damaging storms on the electricity network were:
- Storm Darragh (6-7 December 2024), which brought wind speeds of up to 96 mph and rainfall of up to 100mm in 72 hours, particularly affecting populated areas of Wales, and central and northern England. This caused over 2.3 million customers to lose power.
- Storm Éowyn (24 January 2025) was the UK's 'most powerful wind storm for over a decade', but its track over Scotland and northern England meant the impact on the electricity network was not as severe as Darragh. Over 1 million customers suffered outages, and the time taken to reconnect customers was longer due to prolonged high winds hampering recovery efforts.
Lightning was also a major cause of faults in 2024-25. Lightning strikes can cause surges, which damage equipment if lightning management systems are unable to cope. The relationship between lightning density and outages is quite complex: a single lightning strike which hits critical energy infrastructure can cause many outages, whilst many strikes elsewhere may cause none.
May and September 2024 experienced higher lightning strike densities than average, particularly in the south of the UK, which were associated with increased lightning-related electricity system faults.
What can we learn from the weather in 2024-25?
We also modelled what would happen if 2024-25's weather happened in a projected 2050 power system, which includes significantly more wind and solar power, and increased energy demand. Large scale renewable energy droughts where demand far exceeds the generation from renewable sources such as solar and wind, like those identified in November 2024 and January 2025, would still exist in the projected future power system despite the additional wind and solar generation capacity. Careful consideration is therefore necessary when planning a future electricity network to ensure that additional renewable sources are integrated effectively to ensure a clean, resilient energy system.
There are many open questions around how climate change will impact the frequency and severity of calm, cold conditions, and how best to design a future energy system to mitigate the risks of these conditions. These areas are the subject of ongoing research in the energy-meteorology community.