The Indian Monsoon in a Changing Climate
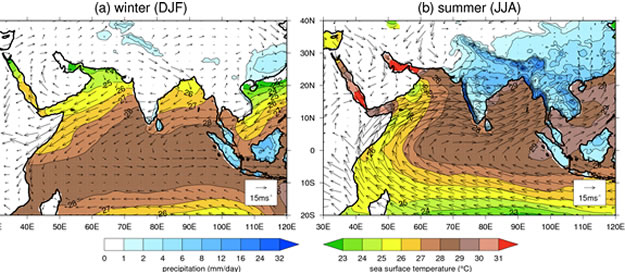
As part of the larger-scale Asian monsoon, the monsoon over India is formed due to intense solar heating in late spring as the solar maximum moves north from the equator. As a result, northern Indian Ocean sea surface temperatures (SSTs) are warmed, along with the plains of north India and the Tibetan Plateau. This latter region lies at an average elevation of over 4500m, meaning strong warming over a significant depth in the troposphere. The Indian Ocean south of the equator is comparatively cooler, so temperature and pressure gradients are formed from south to north. The pressure gradient leads to a cross-equatorial flow, which, when combined with the Earth’s rotation, yields the familiar C-shape of boreal summer monsoon winds in the lower troposphere, as seen in Figure 1. These winds carry moisture evaporated from the warm Indian Ocean to converge over the mountains on the west coast of India before continuing to the Bay of Bengal. There they turn north and towards the west, around the low pressure “monsoon trough” of northern India, where more rain falls. The distinct difference between winter and summer wind and precipitation patterns is what characterises the monsoon over this region.
How will the Indian monsoon change in the future?
Future climate simulations generally suggest an increase in monsoon rainfall on a seasonal mean, area-average basis. This is due to the twin drivers of an increasing land-sea thermal contrast, but more importantly, warming over the Indian Ocean, allowing more moisture to be carried to India. Typically increases in total rainfall over India may be in the region of 5-10%, although some climate models suggest more and some less. Climate simulations also show different patterns of rainfall change, so it is difficult to predict how rainfall might change within India.
A 5-10% change in total rainfall sounds small – does it matter to life in India? The Indian monsoon is remarkably stable as a whole, with a mean total of around 850mm from June to September and an interannual (year-to-year) variation of only around 10% in most cases. However, even these relatively small variations in the Indian monsoon can influence things like agricultural production and the stocks and commodities market, so a 5-10% change on top could have significant impacts.
Floods and droughts
For many people in India, the variability of rainfall on shorter time scales has the most significant impacts – intense heavy rainfall leads to flooding; breaks in the monsoon of a week or more lead to water shortage and agricultural drought.
Floods and droughts are a regular occurrence in India. In 2002, for example, a break in the monsoon rains saw July receiving only about 50% of its normal rainfall, leading to cuts in agricultural output and declining GDP. Thinking about climate change in how these extreme events will change can help farmers and other end users understand its implications.
It’s difficult to say for certain that a particular, extreme event for the monsoon is attributable to anthropogenic climate change – like the Pakistan floods of 2010 – but we do know that with a warming climate, more moisture can be held in the atmosphere, leading to heavier rainfall when it does occur. It is also thought that interannual variability of the monsoon will increase in future, whatever happens to its main driver, El Niño. However, it will not be until we have a better capability at simulating the day-to-day and intraseasonal monsoon variability in our climate models that we will have more confidence in our projections of this important variability. Given the region’s increasing population and need for food security, improving the scientific understanding in these areas is of utmost importance.
References
Rayner, N. A. et al. Global analyses of sea surface temperature, sea ice, and night marine air temperature since the late nineteenth century. J. Geophys. Res. Atmos. 108: 4407 (2003).
Turner, A. G. and H. Annamalai (2012) Climate Change and the South Asian Monsoon, Nature Climate Change 2: 587-595, doi:10.1038/nclimate1495.
Uppala, S. M., et al. (2005) The ERA‐40 reanalysis, Q. J. R. Meteorol. Soc., 131(612): 2961–3012, doi:10.1256/qj.04.176.
Yatagai, A., K. Kamiguchi, O. Arakawa, A. Hamada, N. Yasutomi, A. Kitoh (2012) APHRODITE: Constructing a Long-Term Daily Gridded Precipitation Dataset for Asia Based on a Dense Network of Rain Gauges. Bull. Amer. Meteor. Soc., 93: 1401—1415, doi:10.1175/BAMS-D-11-00122.1.