
The highs, lows and feels of temperature
Temperature is one of the first things that people look for in weather forecasts. Yet, you may be surprised to learn that the number you look for is almost meaningless in everyday life. Let me explain…
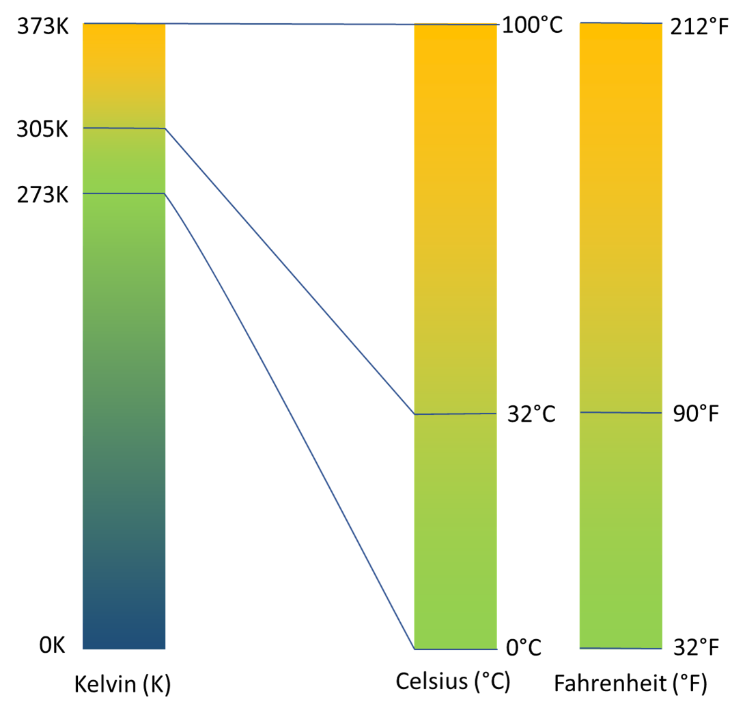
The SI unit of temperature is the Kelvin. The Kelvin, named after its originator Lord Kelvin, is derived from the laws of thermodynamics. It starts at absolute zero, the point at which matter inhabits its lowest possible energy state. It can be calculated without a thermometer, hence it is not ‘degrees’ Kelvin, it is just Kelvin. The temperatures we encounter on the Earth’s surface would make up only a small part of the scale. In other words, the Kelvin is not useful outside a laboratory.
All other temperature scales use a particular physical property that changes in a consistent, predictable way over the temperature range that you are trying to measure. One example is the expansion of a column of mercury, hence its use in thermometers. To calibrate a temperature scale requires fixed points, based on a physical process that we can agree occurs at a set ‘temperature’.
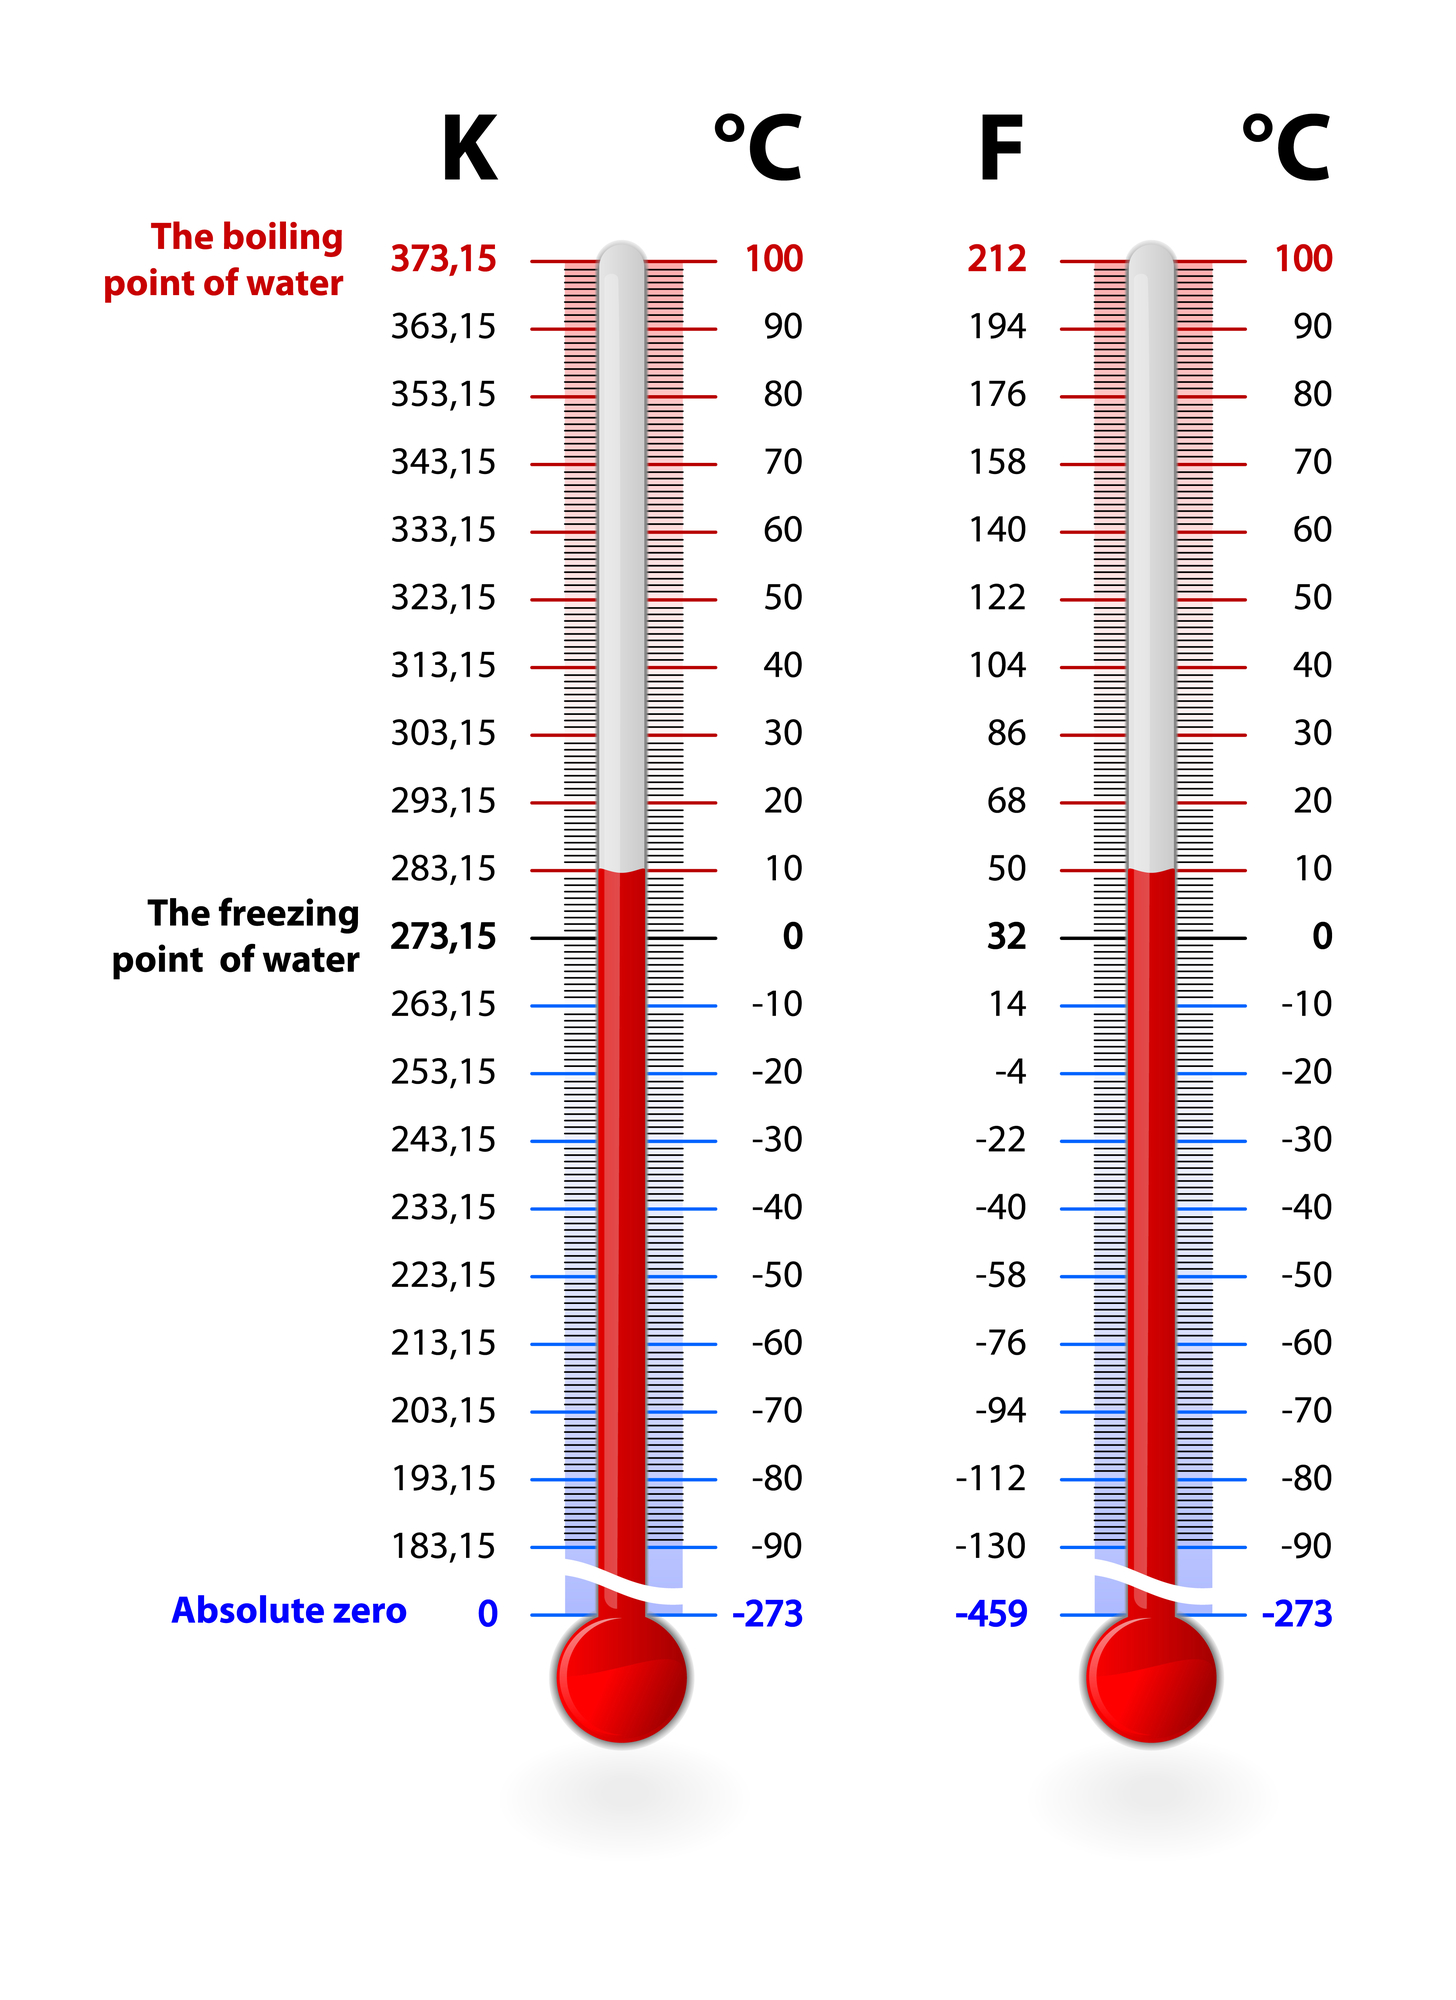
The behaviour of water is especially useful. Water changes state (from vapour to liquid to solid and back again) at the temperatures and pressures we encounter. Changes of state happen at constant temperature and so are easy to reproduce. The freezing point and boiling point of water are used as fixed points on many scales. The lower point is better described as the melting point of ice as liquid water can exhibit some rather strange properties close to its freezing point.
Another property is the electrical resistance of a wire. This is particularly useful when assessing temperature via an automated system. While there are other scales, two came to dominate; Fahrenheit and Celsius. The Celsius scale was previously named ‘centigrade’, and while the change was made as long ago as 1948 the name ‘centigrade’ still persists. Both Fahrenheit and Celsius scales are named after their originators, Daniel Gabriel Fahrenheit and Anders Celsius.
The Celsius scale, which was developed in 1742, sets the melting point of ice as 0 degrees Celsius, usually shortened to 0 °C. It sets the boiling point of water as 100 °C. There are one hundred degrees between melting ice and boiling water.
There have been a few tweaks of Fahrenheit’s original formulation in 1724, and the modern Fahrenheit scale has the melting point of ice at 32°F and the boiling point as 212°F, that is one hundred and eighty degrees between the two. This difference is why the conversion of one scale to the another is a bit tricky!
The Celsius scale is used over most of the globe. The largest exception is the USA. The USA seems to have a fundamental distrust of SI units. I am not sure why but, to quote The Big Bang Theory’s Sheldon Cooper, “What’s life without whimsy?”.
So, should we use Fahrenheit or Celsius (or even Centigrade) in public forecasts? In the UK, many people say they prefer °F, they want it in ‘old money’. However, this is not always the case. The British public’s relationship with °F and °C tends to be seasonal in nature.
In summer, Fahrenheit rules. We want big scary numbers to show that it is really hot! “90 °F heat wave roasts Britain” is a not uncommon summer headline. In comparison, 32 °C just doesn’t sound ‘hot’ enough. I confess that even after 39 years in professional meteorology, I still convert °C to °F in my head, to work out how hot it really is!
In winter, Celsius fights back. We want a low scary number to show it is really cold. Minus 10 °C sounds much colder than 14 °F. Quoting the ‘wrong’ temperature unit at the ‘wrong’ time of year can get you some very funny looks!
Our obsession with the exact values is puzzling. Please do not get me wrong, I love weather statistics. If records are being set, then I am the first in the queue to paw over the data. However, I have worked with many weather ‘enthusiasts’ over the years and I have yet to meet anyone who can step outside and say, ‘it’s 12°C!’.
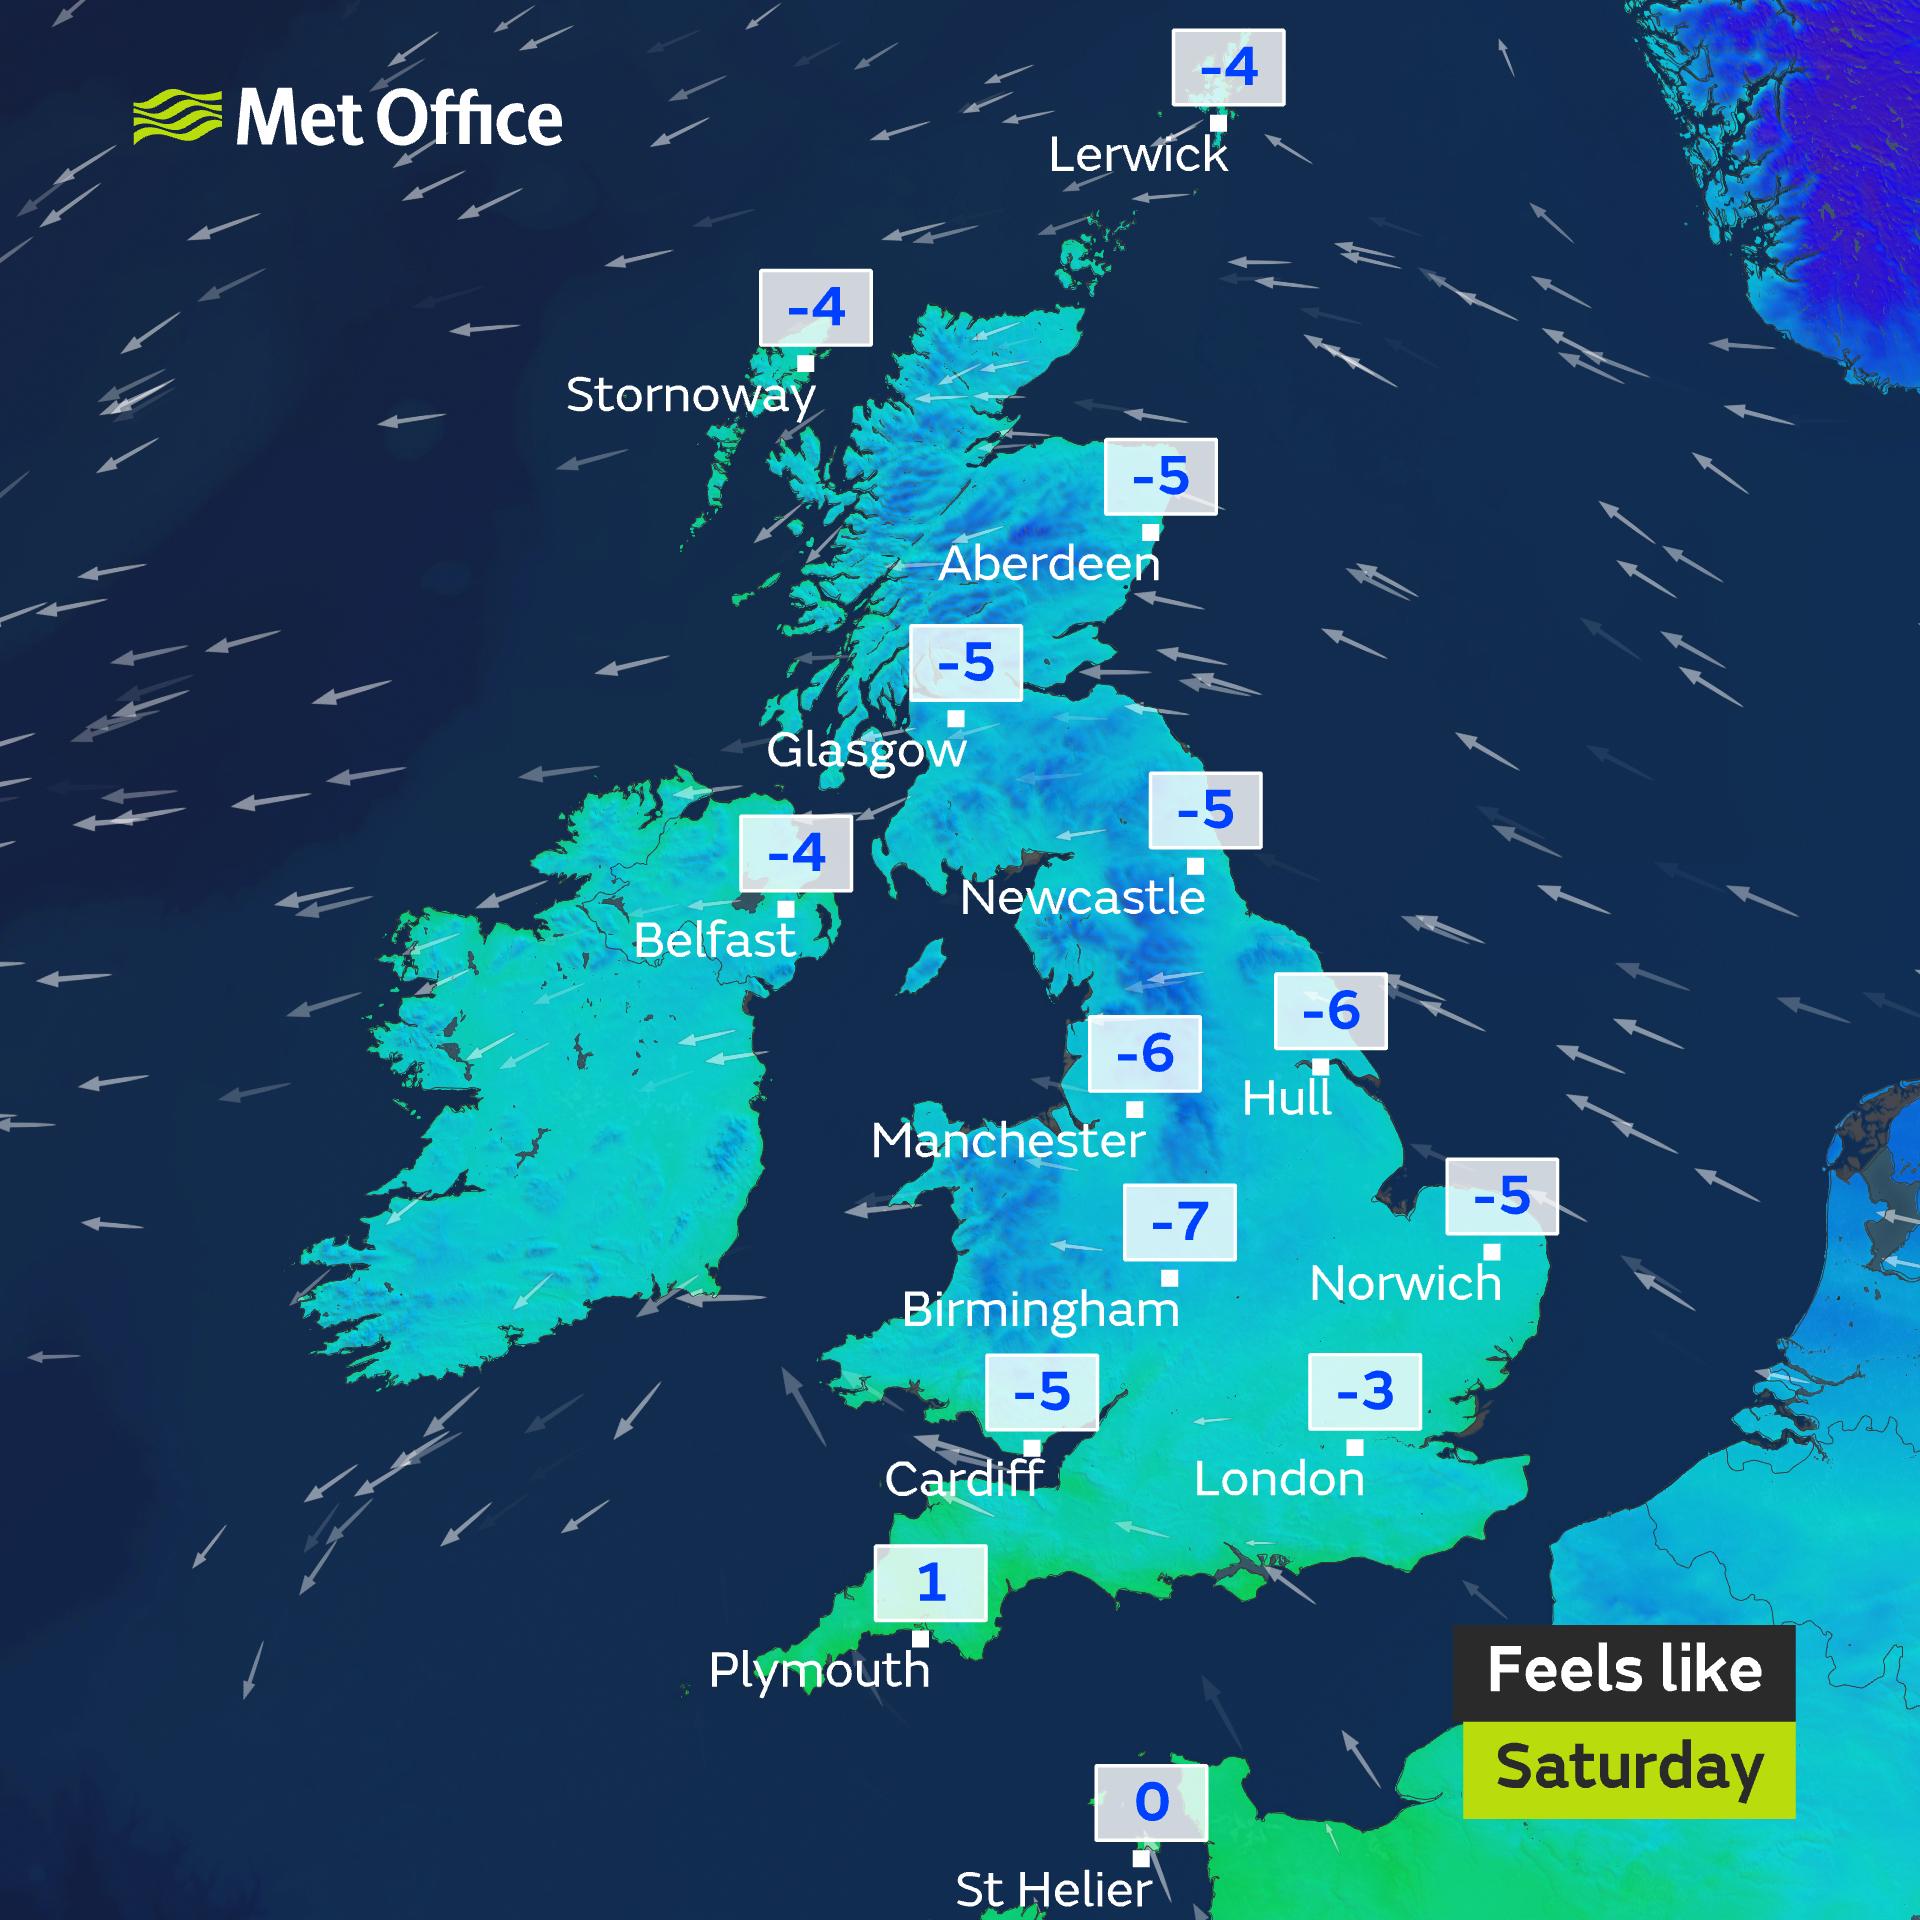
Feels like temperatures on a UK forecast map
Furthermore, 12°C in January feels quite different from 12°C in June and it is the feel that matters. On television, feels like temperature charts are now popular. Personally, I find them very annoying. No one knows what say -10°C feels like, other than it probably feels a bit colder than -5°C! In fact, temperatures do not feel like anything. They are not warm or cold, they are just numbers. It is the temperature relative to your previous personal experiences that matters, and everyone’s experiences are different.
Temperatures in TV forecasts are given as numbers because that is what we want, but the only ‘number’ that we really need is the freezing point of water (melting point of ice), 0° C (32 °F). The change from water to ice has all kinds of impacts, on transportation, gardening etc, and hence it is useful to know on which side of the boundary your location sits.
Apart from weather nerds who just love the statistics, what we are thinking of is the impact of temperature on our lives; “Do I wear a coat, a cardigan or just shirt sleeves”. For this, a forecast that says ‘it will fee’ a little cooler than it was yesterday’ or ‘it will feel much warmer than it has for a while’ is much more useful.
About the author
Frank Barrow retired from the Met Office in 2020, after a career of 39 years during which he worked as an observer in the 1980s, a forecaster in the 90s and, since 1996, as a trainer at the Met Office College. He describes the latter role as “fitting him like a glove”, so he stayed... for almost 25 years! During that time, he was involved in the training of the vast majority of current Met Office forecasters.


, resting on a green leaf")