
Show your stripes 2023
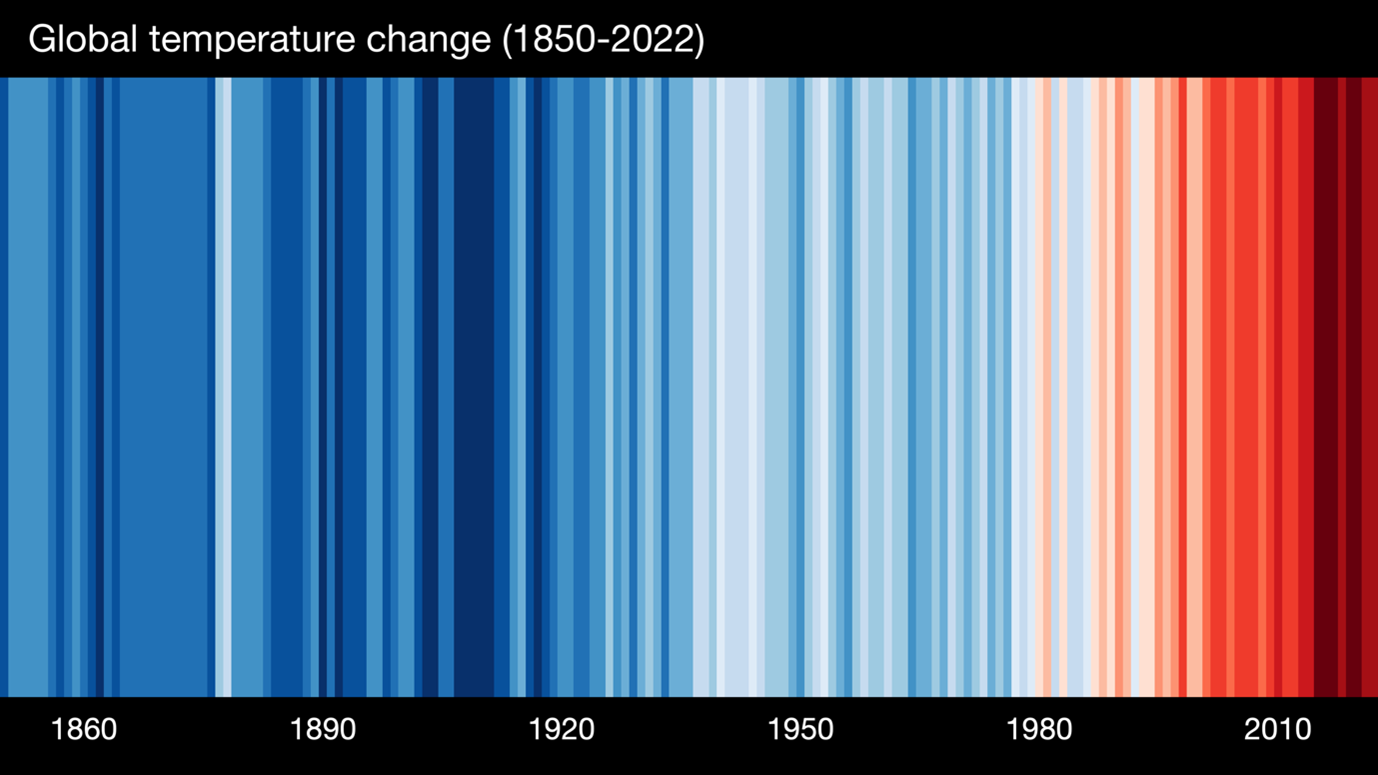
Communicating climate change can be a challenge, but the 'warming stripes' created by Climate Scientist and Society Fellow, Professor Ed Hawkins (University of Reading) is a brilliant way to do it.
Ed's simple visualisation has no words, no numbers, no graphs, it is simply a series of vertical coloured bars. Each bar, or stripe, represents the average temperature for a single year relative to the average temperature over the period as a whole. The blue stripes show when the average temperatures have been below average and the red stripes when temperatures have been above average.
In just a glance, the stripes paint a very clear and striking picture of how global average temperatures are rising rapidly, as the bars shift from mostly blues to mostly reds.
Ever since the stripes were created in 2018, they have been used globally to communicate the rapid rise in global temperatures that has been taking place in recent decades.
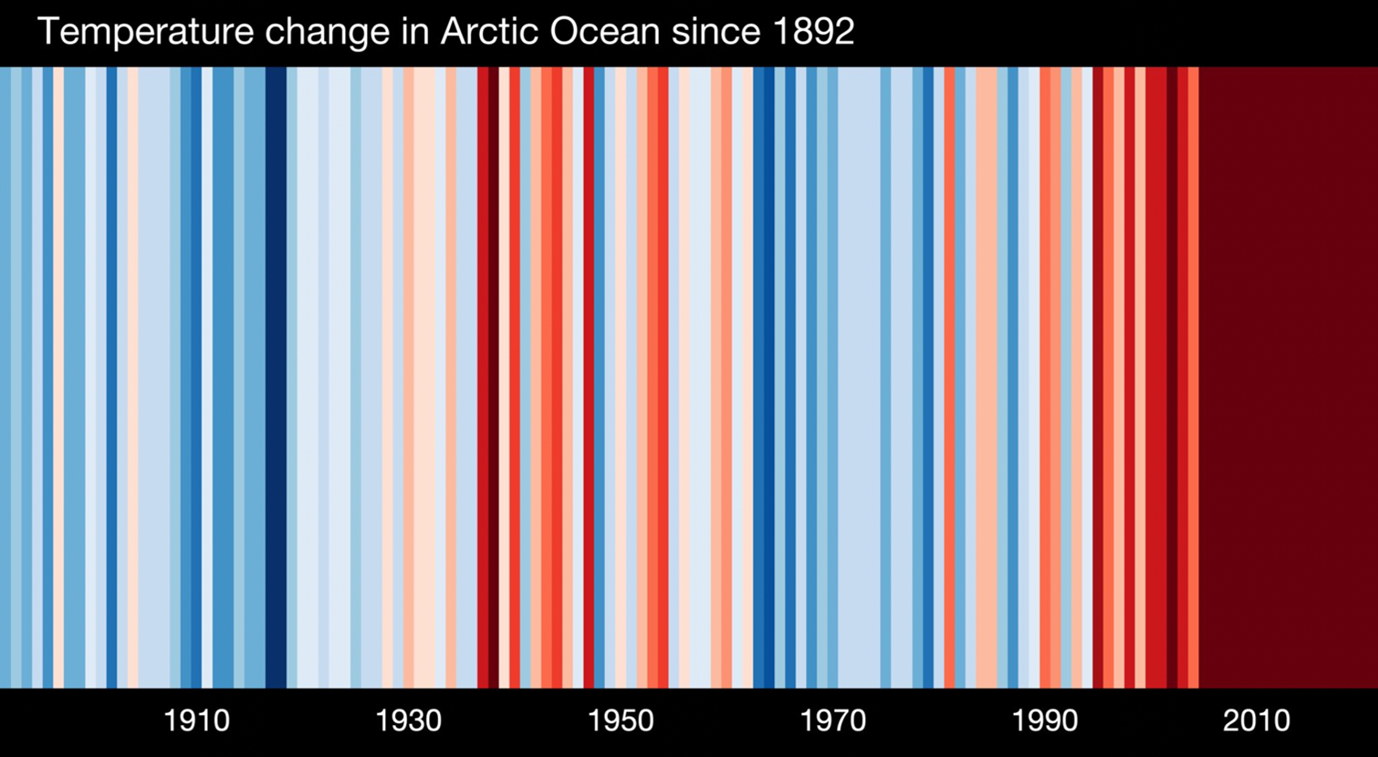
One region that is warming faster than anywhere else is the Arctic. Research has shown that the Arctic is warming around 4 times faster than the global average. The warming stripes for the Arctic Ocean (below) are visually striking, with the block of deep reds in recent decades showing just how fast the temperatures here have been rising.
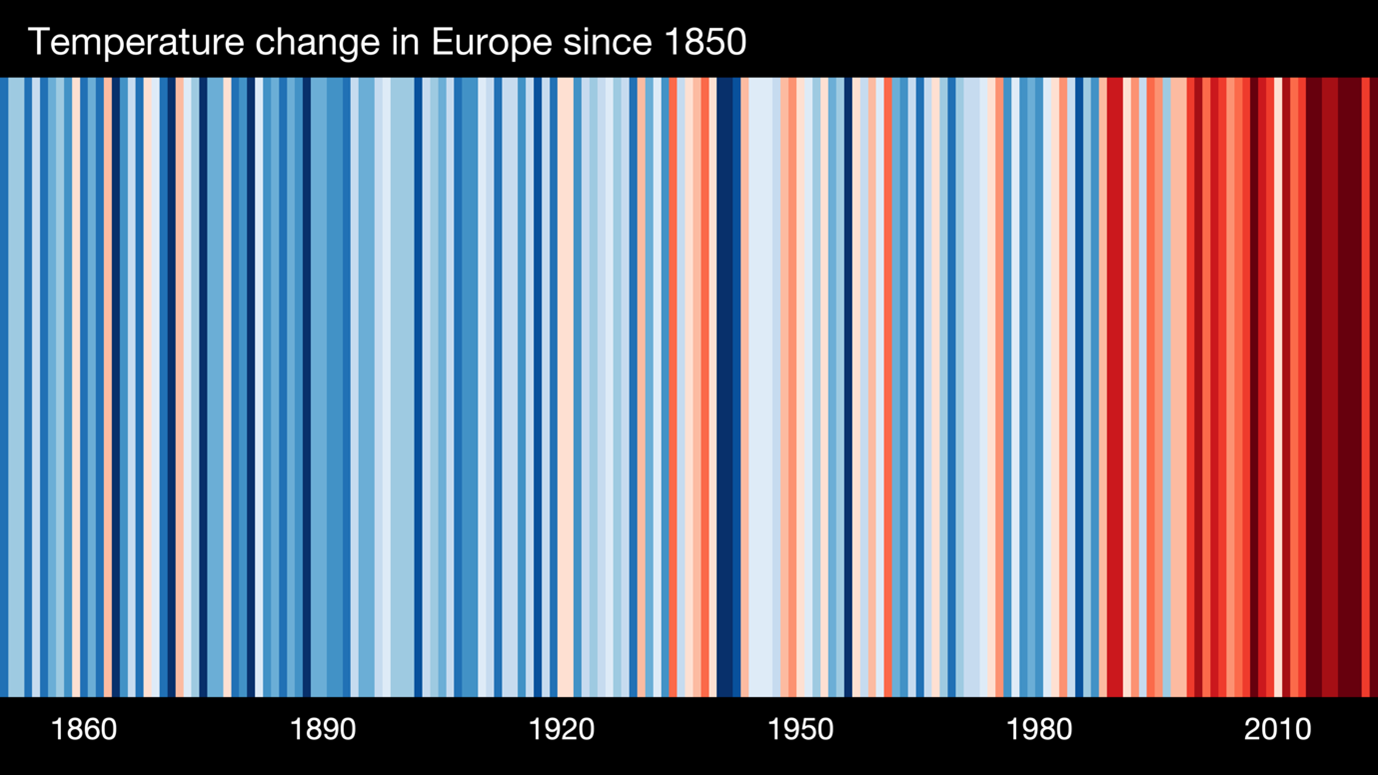
A recent report published by the World Meteorological Organization and the Copernicus Climate Change Service, has shown that Europe is the fastest warming continent in the world. The warming stripes for Europe (below) clearly show this rapid warming that has been occurring in recent decades.
The warming stripes are already having a massive impact. More than a million people downloaded graphics from the site within a week of its launch in 2019 and since then they have been used worldwide, gaining iconic status.
The summer solstice in the northern hemisphere, 21 June, is #ShowYourStripes day. Meteorologists and scientists around the world will share the warming stripes to start conversations about climate change, promote awareness of the climate crisis, and stress the urgent need to take action now.
If you’re a @readingfc fan going to the match today, are you wearing your warming stripes?
— Ed Hawkins (@ed_hawkins) August 6, 2022
They are a fantastic way to start climate conversations with other fans. #ShowYourStripes #readingfc #REACAR pic.twitter.com/FvkpYYzbcL
The graphics are free to use and have already been used in a variety of ways to raise awareness of climate change. The stripes have appeared on the Main Stage at the Reading Festival, on badges worn by US senators, at school climate strikes, and on electric cars, trams and trains. They have also been printed on clothing, mugs and scarves as well as on the shirts of Reading football team.
Download the warming stripes for your country, continent or region to start your own conversation about climate.
About the Author

Gemma Plumb has been a meteorologist for over 15 years and is currently working for DTN as a media meteorologist at the BBC. She has also forecast for a variety of sectors including energy, media, transport and utilities.
Gemma is one of the creators and hosts of the weather podcast - For the Love of Weather - which looks at the science behind weather and climate and how weather can impact our daily lives.
A keen science communicator, she is passionate about sharing her love of the weather. You can find Gemma on TikTok making funny, engaging and educational weather-related videos (@theweatherpud).
 © Ed Hawkins, University of Reading")


