The State of the UK Climate 2020
In February 2020, hundreds of properties were affected by devastating flooding from storms Ciara and Dennis arriving only one week apart in what was the wettest February on record for the UK. In August 2020, a major heatwave affected much of southern England. And in October 2020, the UK recorded its wettest day on record.
Climate change has already increased the risks and impacts of these types of extreme weather events in the UK. Around the world, the intensity and frequency of heatwaves, such as the recent event in Canada, may be attributed to climate change, and, since a warmer atmosphere can hold more moisture, this link may also extend to extreme rainfall.
In this country, we are lucky to have a rich legacy of observational data from systematic networks of weather stations. That legacy stretches back to the origins of the Met Office in the 19th century, and early instrumental measurements in the 17th century. This observational record – with routine monitoring an important legacy of our Victorian predecessors - is vital in providing us with a long-term context. So, what do these observations tell us about the current state of our climate?
What is the State of the UK Climate report?
The State of the UK Climate 2020 report provides an accessible, authoritative and up-to-date assessment of UK climate trends, variations and extremes based on the most up-to-date observational datasets of climate quality. The report is an annual publication by the Met Office, published as a Special Supplement to the Royal Meteorological Society’s International Journal of Climatology.
The report presents a summary of the UK weather and climate through the year 2020, looking at key variables – temperature and rainfall – as well as sunshine, wind and snow. It compares year 2020 against the most recent decade 2011-2020 (our most recent experience of the UK’s climate), 30-year averages for 1981-2010 and 1961-1990, while the full climate series provide a critical long-term perspective. This year’s report also contains a first look at the 1991-2020 climatological reference period.
Much of the report is based on the HadUK-Grid dataset of 1km resolution gridded climate data for the UK, built from the full collection of historical weather station observations stretching back to 1862. It is a key resource for monitoring the UK’s climate. The report also includes a section on sea level rise around the UK by the National Oceanography Centre and a summary of first leaf and bare tree dates for four common tree or shrub species by the Woodland Trust using Nature’s Calendar Citizen Science data.
What are the key findings?
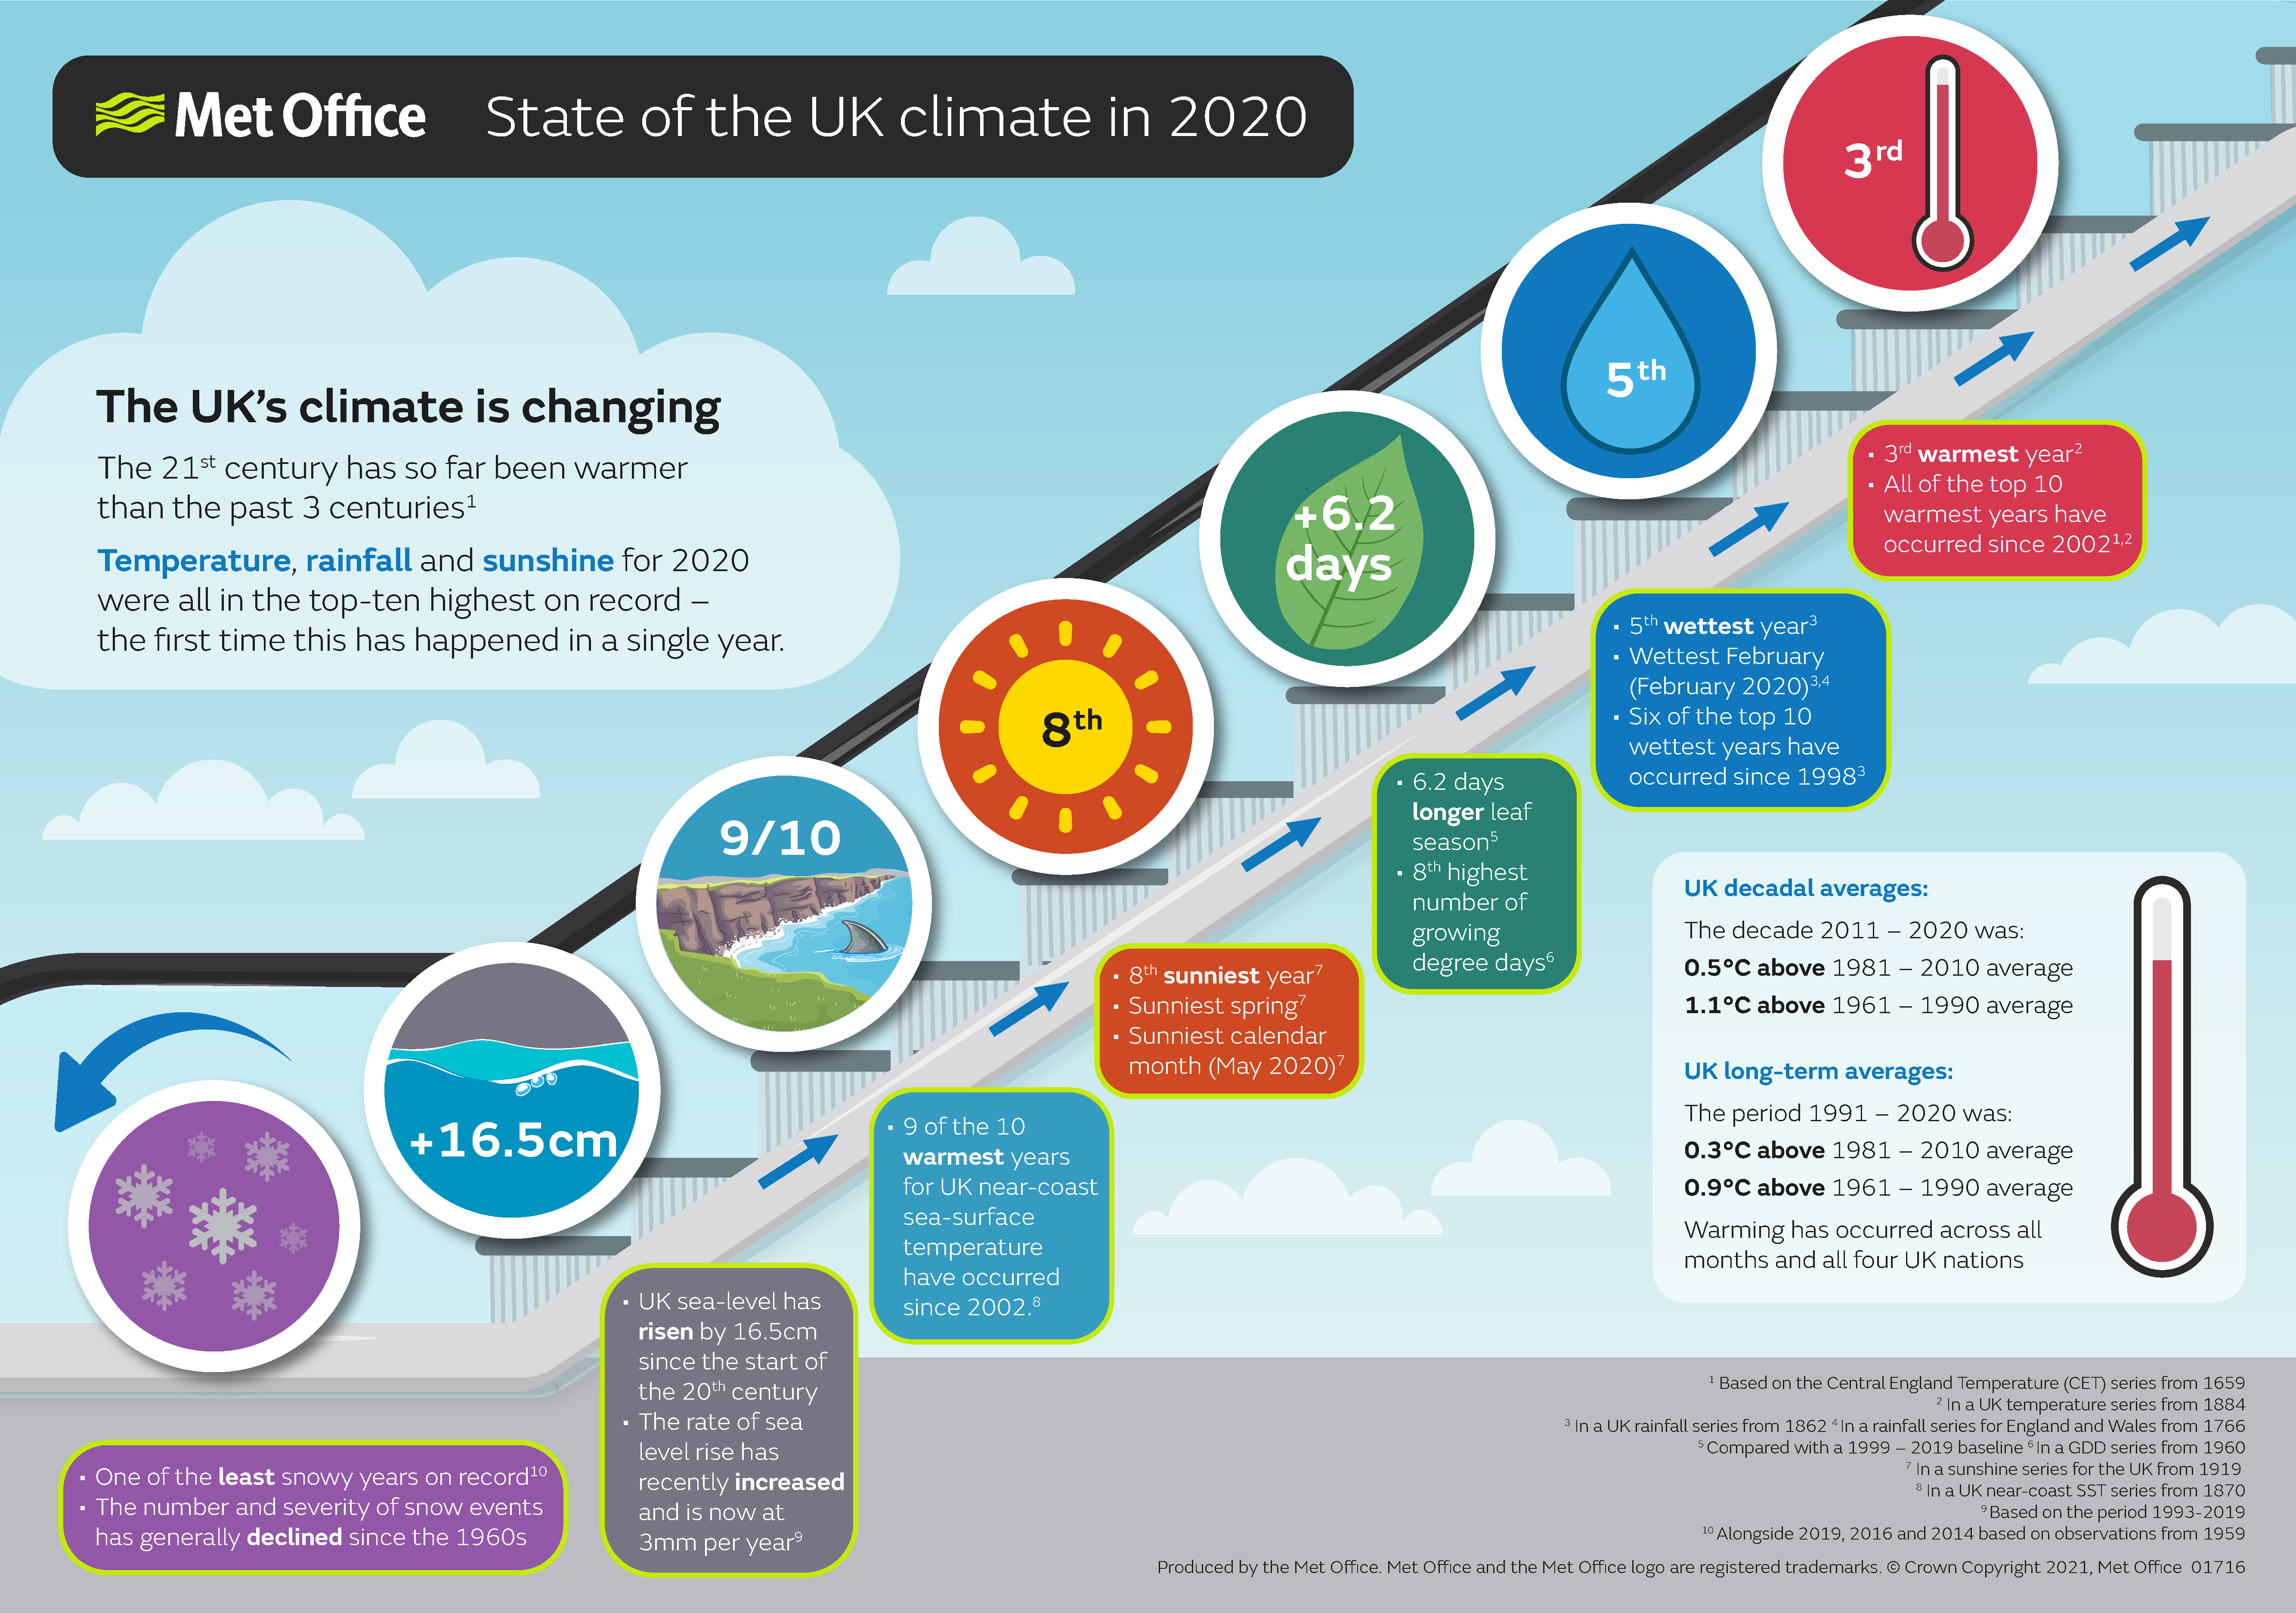
The observations provide evidence that the UK’s climate is already changing. Recent decades have been warmer, wetter and sunnier than the 20th century.
All top-ten warmest years for the UK in a series from 1884 have occurred since 2002, and six of the ten wettest years for the UK in a series from 1862 have occurred since 1998.
The latest year is consistent with this general picture: 2020 was the third-warmest, fifth-wettest and eight sunniest year on record for the UK, and no other year has fallen in the top-ten for all three variables.
A preliminary comparison of 30-year long-term averages for the periods 1961-1990 and 1991-2020 show that the UK’s climate has warmed by 0.9°C with rainfall increasing by 6%.
What about extreme weather events?
The inherently variable nature of the UK’s climate means that extreme weather events are to be expected in any given year. However, the extreme weather events of 2020 are generally consistent with this picture of a changing climate, particularly an increase in high temperature and high rainfall extremes.
37.8°C was recorded on 31st July, the UK’s third warmest day on record, and southern England was affected by a significant heatwave in August, with 34°C exceeded for seven consecutive days. 34°C has been reached in seven of the last 10 years 2011-2020 compared to seven out of the previous 50 years 1961-2010. The likelihood of extreme summer temperatures affecting the UK has increased, for example a recent study on the hot UK summer 2018 found it was 30-times more likely as a result of human influence on the climate system.
Two of the three wettest days on record for the UK (in a series of more than 47,000 days) occurred in 2020; again with a recent study estimating that the record rainfall of 3 October 2020 was 2.5 times more likely as a result of this human influence.
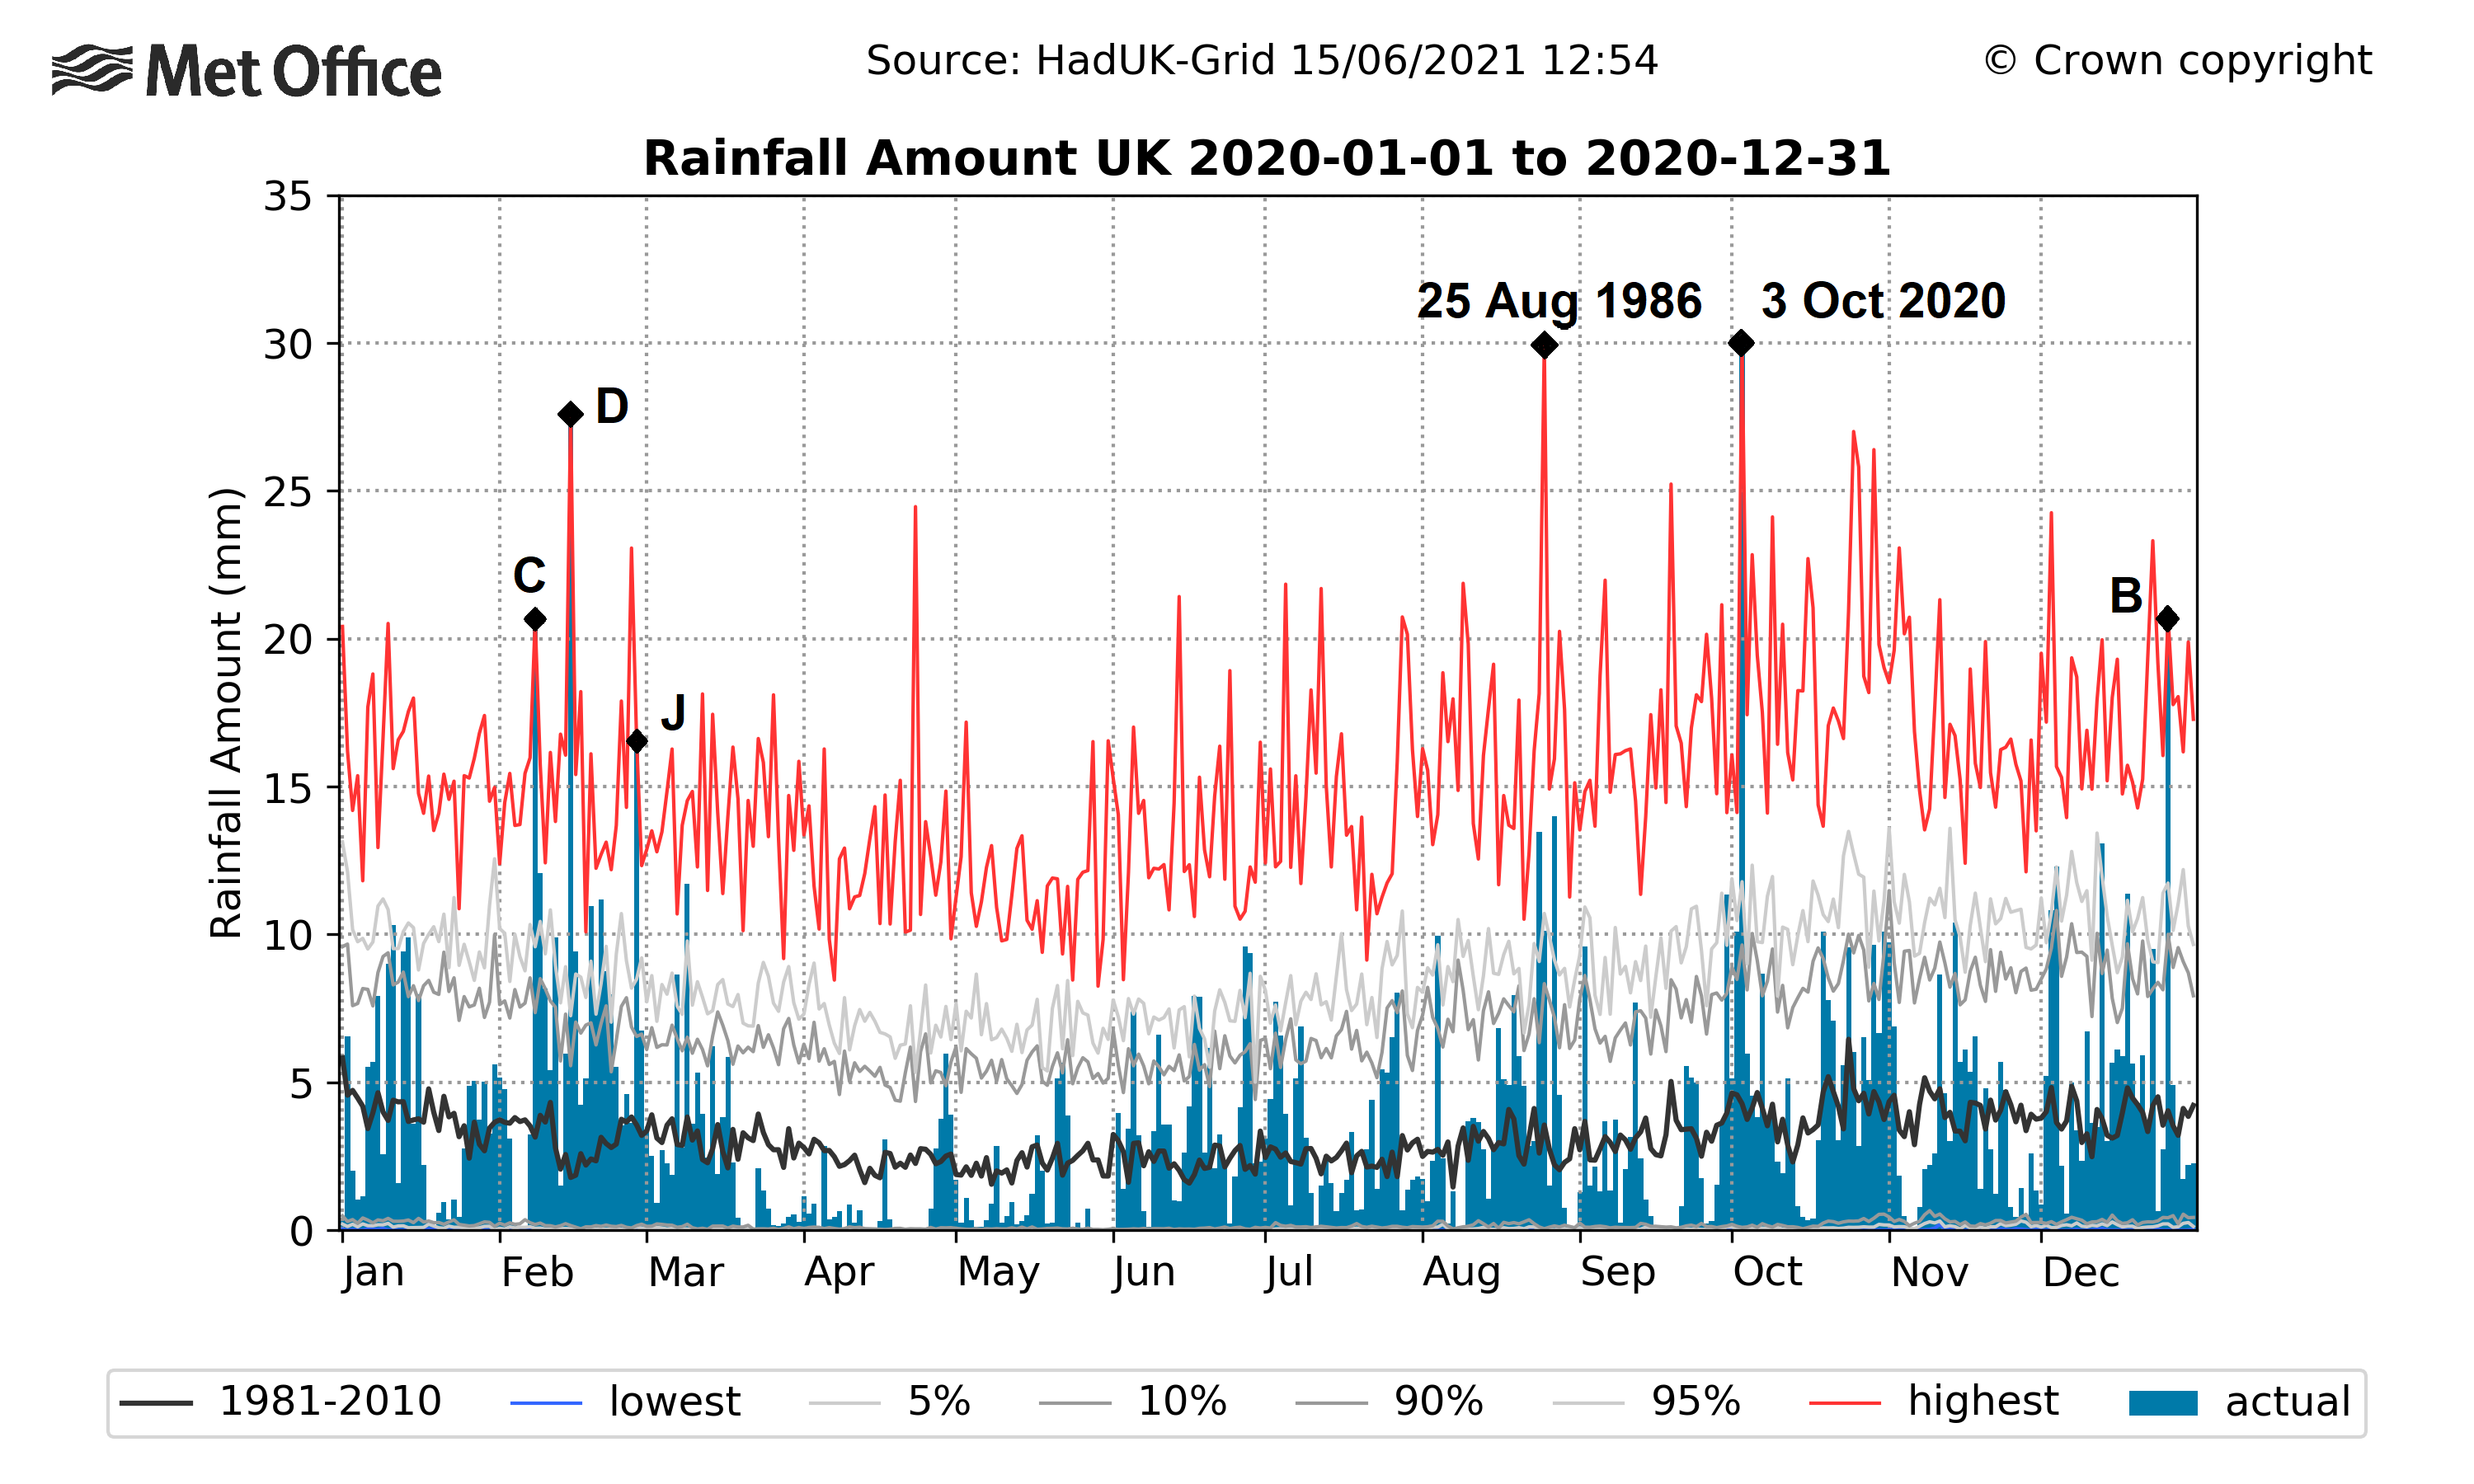
Storms Ciara and Dennis formed part of the wettest February on record for the UK in a series from 1862, and for England and Wales since 1766 – these storms followed recent severe flooding only three months earlier in November 2019. The UK has recorded its wettest February, April, June, November and December on record – five out of twelve months – in just over ten years.
Overall this report paints a picture of the emerging influence of climate change in the UK’s observations. It is happening now, and this report helps illustrate and update the vital observational evidence.
About the author

Mike Kendon is a climate information scientist at the Met Office National Climate Information Centre (NCIC), which he joined in 2009. He helps develop and maintain systems to monitor the UK’s climate based on observations from the surface network of weather stations, and is the lead author for the Met Office’s State of UK Climate report.
 © Ed Hawkins, University of Reading")


