
Wildlife and weather in a changing climate
The recently released State of the UK Climate 2020 report revealed that last year was the third warmest for the UK since 1884. In fact, all the top 10 warmest years since 1884 have all occurred since 2002. Not only was 2020 warm and sunny, it was also the fifth wettest on record.
A long history of recording weather in the UK means we can find trends in how our climate is changing. Bringing the most recent decade to a close, the report finds that the 2011-2020 average temperature is over 1 °C warmer than the average for 1961-1990 and 0.5 °C warmer than 1981-2010. The weather in 2020 fitted the trend that recent decades are warmer, wetter, sunnier than those in the 20th century. So how are these changes affecting our wildlife?
Recording seasonal change
Thankfully it’s not just the weather we have a fascination with in the UK. We also have a history of observing the seasonal behaviours of animals and plants. Examining the timing of seasonal events in nature - such as when leaves unfurl or later change colour, or when flowers open – is known as phenology.
The annual cycle of a tree can be tracked in a series of phenology events, from budburst and new leaves, to autumn tinting and leaf fall. And animals have key events, too, like awakening from hibernation or diapause (insects), breeding and migration. Each of these is intricately related to the weather.
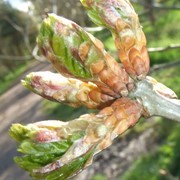
Credit: Judith Garforth
The Woodland Trust’s Nature’s Calendar project gathers phenological observations that are noted down by the general public all over the UK. Records from this citizen science project are added to our database of records that date back to 1736, giving us an insight into how weather, and climate change, impacts the timing of natural events.
A closer look at weather and phenology
But what do weather trends from the most recent, record-breaking decade actually mean for wildlife? It’s useful to take a closer look at an example to illustrate.
Jean Combes started her phenological records in 1947, and still continues to record today. All of these records are safely stored in the Nature’s Calendar database. One of the events Jean records annually is the first budburst on her chosen local oak tree.
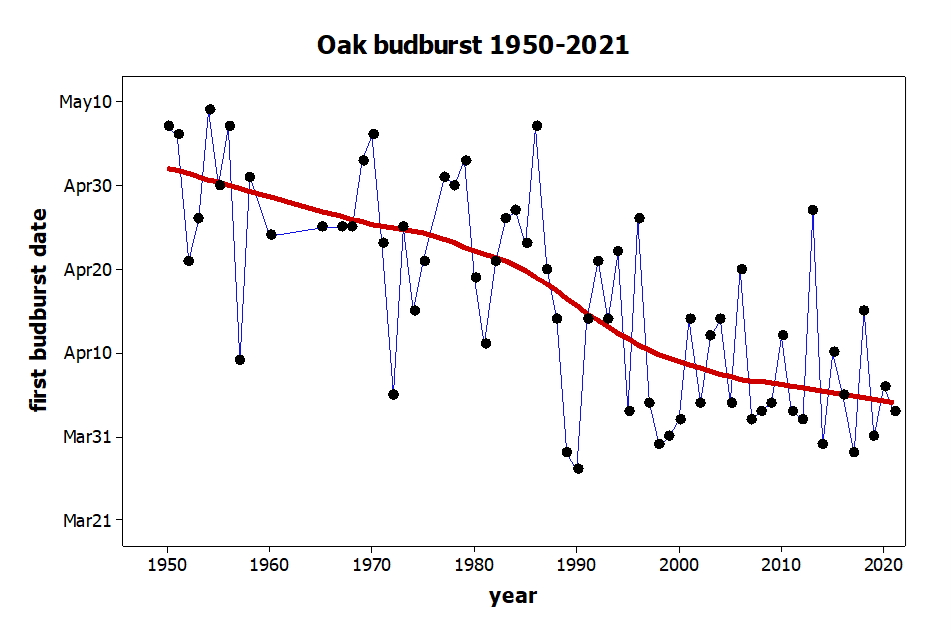
The graph above shows how variable the timing of this oak’s budburst is from year to year, as the tree reacts to local weather conditions each spring. There is also a general trend towards budburst happening weeks earlier now than when Jean began recording. This illustrates how the tree has reacted to the warming climate over this period.
The power of citizen science
Not only does the Nature’s Calendar span nearly 300 years, it also holds nearly 3 million phenology records. Having so many records for each natural event means we can take a robust average for the whole of the UK, levelling out the impact of local factors that will impact the timing of an event, such as a microclimate.
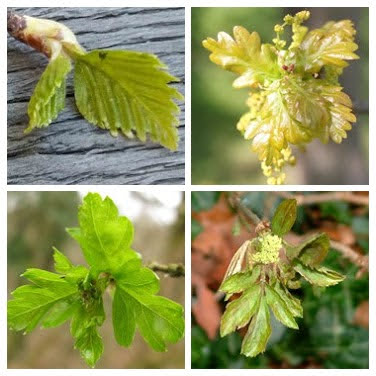
Credit: Judith Garforth, Kylie Harrison Mellor, Margret Barton and Christine Tansey
The records of two Nature’s Calendar tree events were used for the State of the UK Climate report 2020; the first time a tree produces a leaf in the spring, and when the tree or shrub becomes bare in the winter. Records from four species were analysed: elder, hawthorn, silver birch and pedunculate oak (elder and hawthorn are two of the earliest shrubs to leaf). The average for these was compared to the average from our Nature’s Calendar baseline (1999-2019).
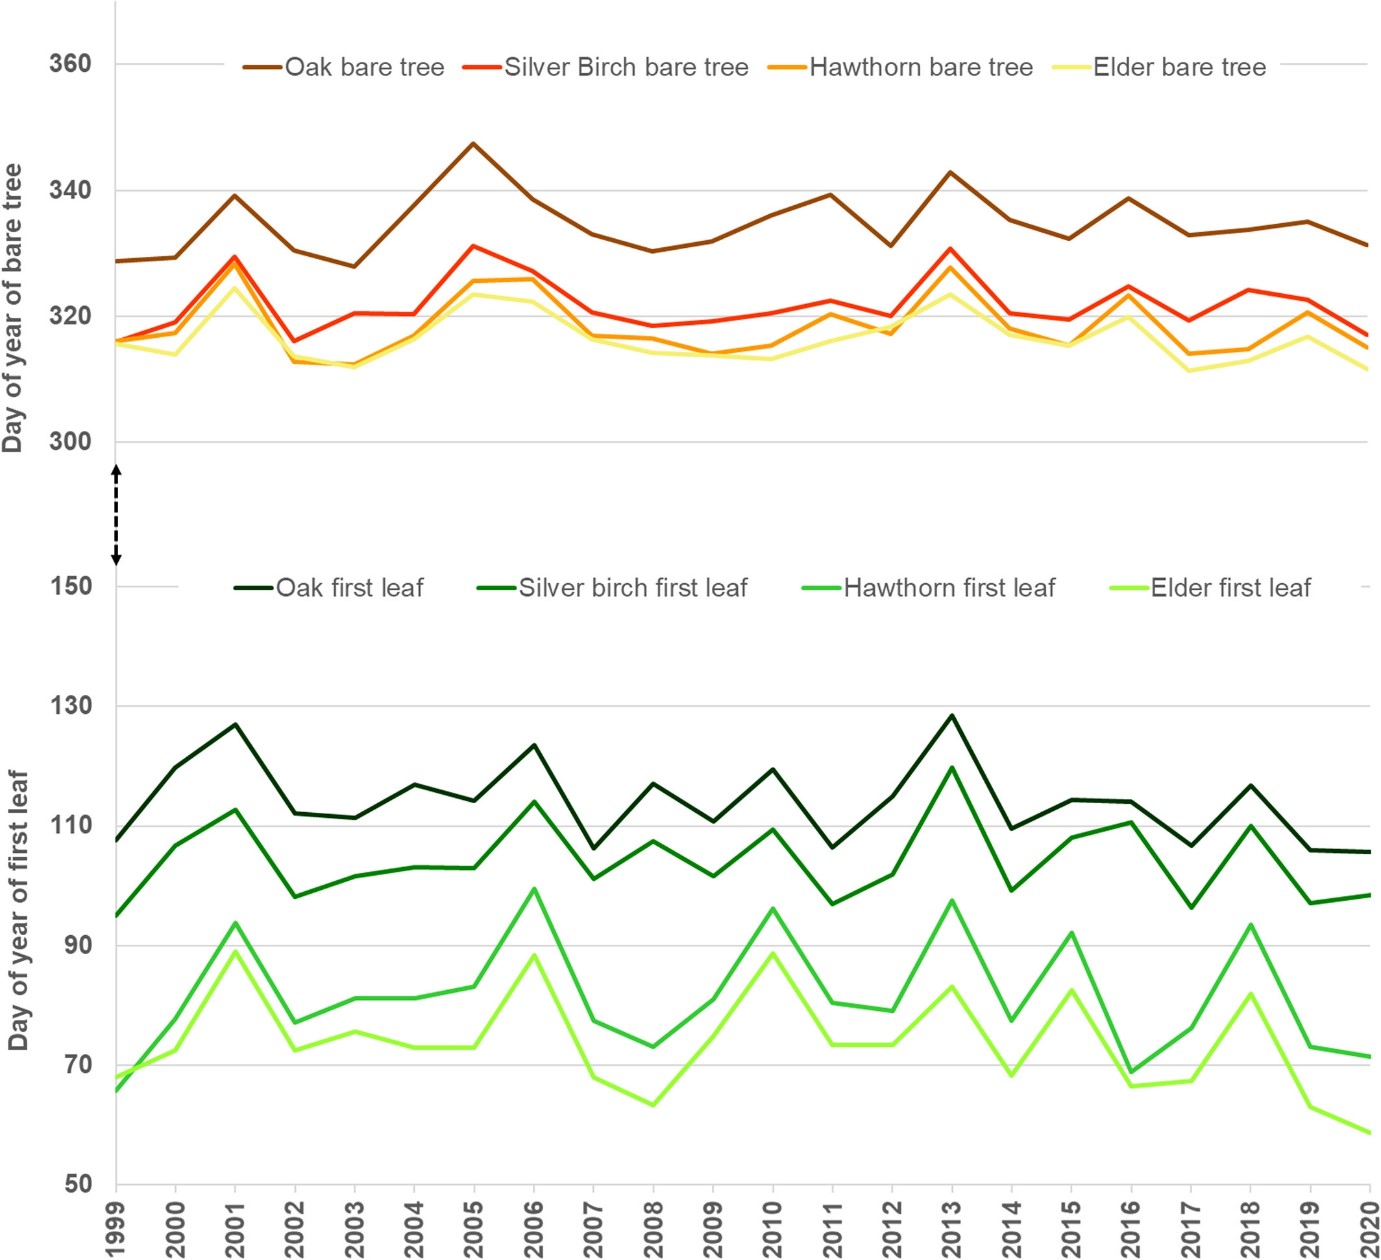
Mean day of year of first leaf and bare tree phenology indicators for four common shrub or tree species:
Elder, Hawthorn, Silver Birch and Oak, derived from UK observations contributed to Nature's Calendar from 1999 to 2020. Credit: Figure 72 in the State of the UK Climate 2020 report (International Journal of Climatology, Kendon et al 2021)
The results showed that in 2020, the combined average first leaf date for these species was 10.4 days earlier than the baseline average. The average first leaf on pedunculate oak was the earliest in the 1999-2020 series. A clear indication that spring was early in 2020. At the other end of the year, autumn was early, with average bare tree dates being over 4 days earlier than the 1999-2019 baseline average.
Why does this matter to our wildlife?
Phenology research has focused on the impacts of shifting springs, largely because this season is much better recorded than autumn. Further research using Nature’s Calendar records has shown that a mismatch in the timing of natural events along a food chain can have implications for wildlife. A study published in Nature Ecology and Evolution also found that oak trees produce first leaves earlier in an earlier spring. Furthermore, that the moths, whose caterpillars consume the new oak leaves at their most palatable, can react and advance their breeding when we get a mild start to the year, like we saw in 2020.
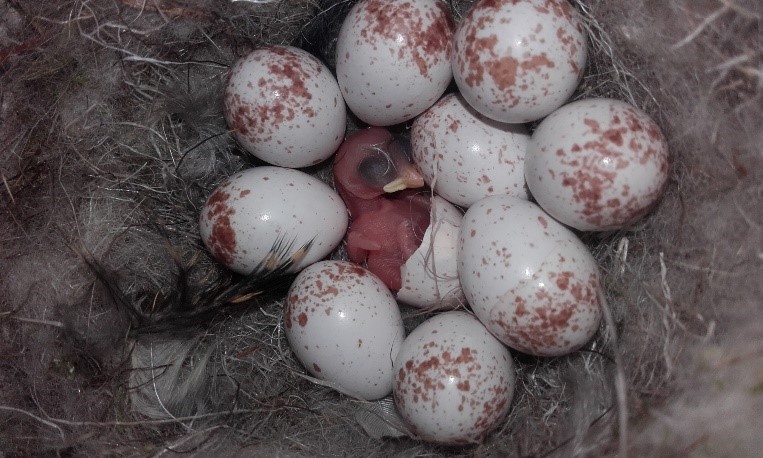
Credit: Jack Shutt
In the next stage of the food chain the research found that, in an early spring, there is a potential ‘mismatch in timing’ between the caterpillar availability and the breeding cycle of birds such as blue tits, great tits and pied flycatchers. With a hungry blue tit chick being able to eat around 100 caterpillars a day and an average brood size being 8-10, it’s important birds time their breeding so that their chicks are at their hungriest when the peak number of caterpillars is available. Amid a myriad of other threats, this impact of climate change is yet another pressure they face.
Phenology needs you!
Have you noticed that some years you might see snowdrops or hazel catkins before Christmas, spotted a butterfly or frog spawn before Valentine’s day or been able to make a blackberry crumble in July? Perhaps without knowing it you’re a natural phenologist!
Help us to study the impact of weather and climate on wildlife and contribute to this critical body of evidence. It’s easy to take part and records can be added online at Nature’s Calendar.
If you want to know more, this talk hosted by The Royal Meteorological Society discusses the history and recording of phenology, the timing of natural events in the UK and how this has evolved into a network of voluntary recorders coordinated by the Woodland Trust. And of course, how the weather affects phenology.
 About the author
Lorienne Whittle is a Citizen Science Officer at the Woodland Trust, working as part of a job-share with Judith Garforth (co-author of the phenology section in the State of the UK Climate 2020 report) looking after Nature’s Calendar. Together they are responsible for everything from encouraging and supporting the public in recording phenology to facilitating and co-authoring some of the important science outputs for the project. Lorienne enjoys watching out for and recording seasonal events near her rural Lincolnshire home and relishes any opportunity to engage and inspire people to become involved in nature conservation.


, resting on a green leaf")
