
Olympic Ceremony features UK scientist's climate spiral
With the world watching, Brazil’s Olympic Opening Ceremony was the perfect platform to educate more than three billion viewers about global warming and climate change.
Within a bright, booming and creative ceremony, our changing environment was a key feature. A short video on anthropogenic climate change, narrated by Dame Judi Dench, included maps and graphics showing how rapidly the earth’s temperature is rising, the staggering amount of ice that has melted over the last century and how rising sea levels will flood cities around the world in the future.
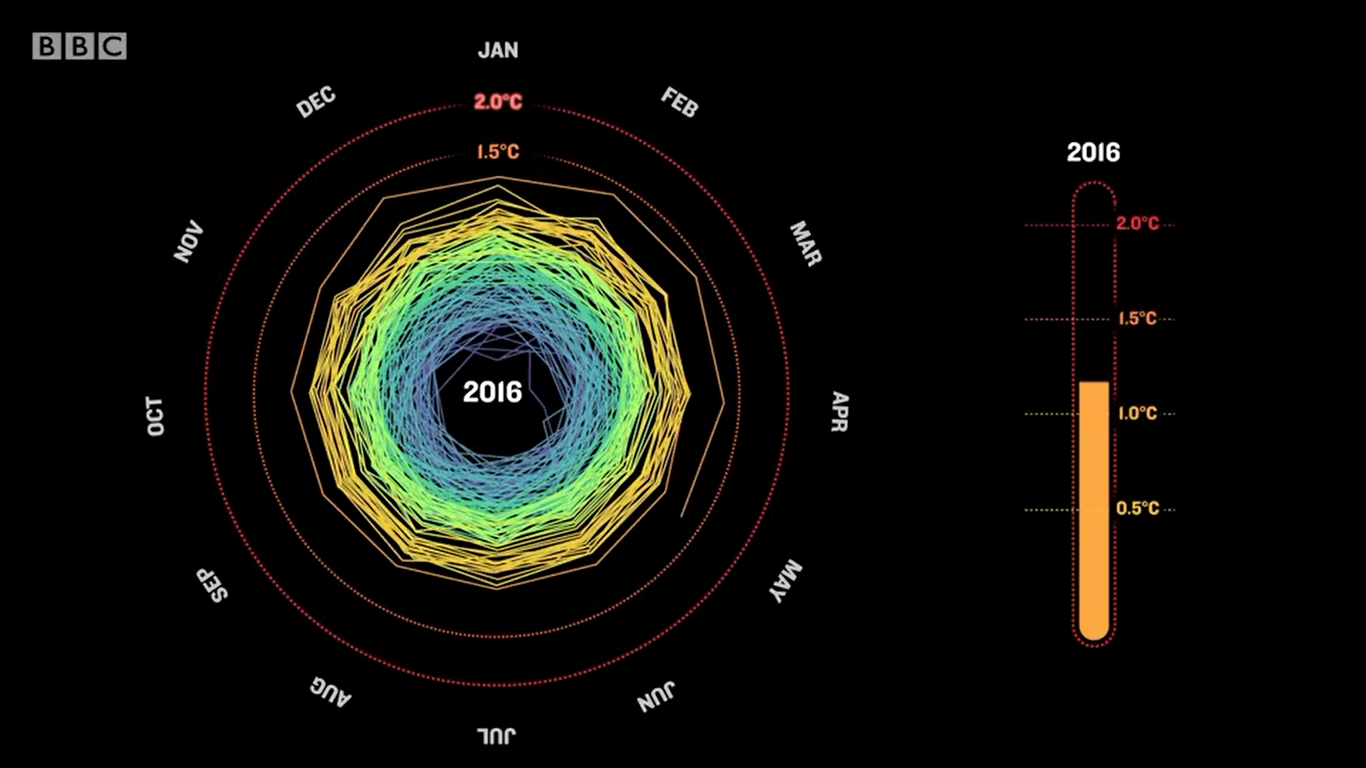
Featured in the video, was a graphic illustrating how global temperatures have risen by more than 1.0C since 1850. The graphic was almost identical to that produced by Dr Ed Hawkins, climate scientist with NCAS at the University of Reading and RMetS Fellow, that was featured earlier this year on his blog ClimateLabBook and re-tweeted over 15,000 times.
However, Ed’s twitter revealed he was clueless that the GIF he produced back in May this year was being used in the Olympic Ceremony, stating “It was quite a shock” when we asked what his reaction was. Although Ed had no idea his work was to feature, he was clearly delighted to see climate change included "It was fantastic that the organisers of the Opening Ceremony chose to highlight the risks of climate change in this way to so many people around the world. It is a truly global issue which will affect all nations and requires strong international collaboration to understand and tackle."
When asked how the idea for the graphic first came about, Ed explained “For the original GIF, I wanted to try and visualise changes in global temperatures in different ways to learn about how we might improve our communication. The spiral presents the information in a straightforward way which appears to resonate with people.”
Since Hawkins first published the graphic back in May 2016, many different people and organisations have adapted the graphic to illustrate numerous other climate issues.


