
Shifting the baseline for UK heatwaves
The purpose of the Met Office heatwave definition is primarily to support public communication during heatwave events, and complements but does not replace the heat health planning service for health and social professionals or the extreme heat warning service that promotes advice to keep people safe in the heat. The origins of the heatwave definition are described in detail in a paper in Weather which also further documents the requirements that the definition is scientifically justifiable, reflects common perceptions of heatwaves, captures variations in climate across the UK, and is adaptable to current and future climate change.
In March 2022 the Met Office announced that the official heatwave thresholds were being updated ahead of the summer, resulting in eight counties having their threshold increased by 1 °C. Surrey, Berkshire, Buckinghamshire, Bedfordshire, Hertfordshire and Cambridgeshire increased from 27 °C to 28 °C, Lincolnshire increased from 26 °C to 27 °C, and East Riding of Yorkshire increased from 25 °C to 26 °C. The original thresholds were derived from the distribution of July daily maximum temperatures in a 1981-2010 reference climate period, and the change in threshold results from the Met Office update to a 1991-2020 reference climate.
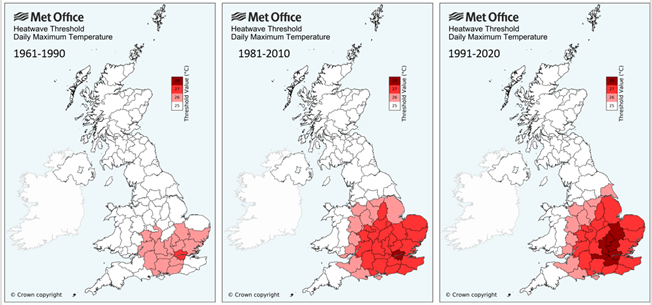
The central map above shows the original thresholds, the right hand one the updated thresholds and, as an additional demonstration of our changing climate, the left hand one shows what they would have been if we had had this definition in place for 1961-1990.
Why have only some places changed?
The UK has experienced an undeniable warming trend, as a consequence of global climate change. This can also be seen in how the heatwave threshold varies over time based on the distribution of daily maximum temperatures during different reference periods. The maps in Figure 1 compare the equivalent heatwave thresholds as derived from a 1961-1990, 1981-2010 and 1991-2020 reference period. Thirty-year climate reference periods, as defined by the World Meteorological Organization, provide a compromise of capturing most of the natural variability in our climate, but updating every ten years to reflect our changing climate. An important aspect of the definition is simplicity, so the thresholds are rounded to whole degrees. The average warming between the 1981-2010 and 1991-2020 periods is 0.3 °C. Therefore, in this update of the thresholds those counties that have changed are those where this increase in temperature has tipped the balance into the higher threshold category. Overall warming rates in the UK have also been slightly higher for parts of central and eastern England where the heatwave threshold has increased.
Doesn’t this mask the impact of climate change?
Climate change is making heatwaves both more likely and more severe. One criticism of changing the heatwave threshold is that this could be seen as an environmental ‘shifting baseline syndrome’, normalising a gradual shifting of what is acceptable, and masking the negative impacts resulting from our warming climate.
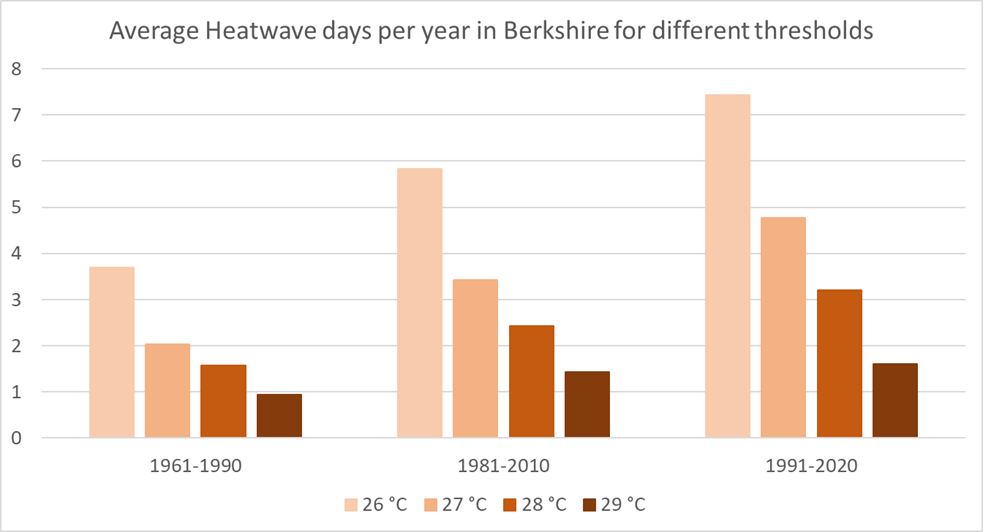
We can explore the impact of the changing thresholds for one of the counties affected, Berkshire (see Figure 2). If we look at the average number of heatwave days per year1 for different reference periods and against different temperature thresholds we can see that during 1961-1990 a threshold of 26 °C results in an average of between 3 and 4 heatwave days per year2 while higher threshold events are less common. For the 1981-2010 period a comparable number of events (3-4 days) result from a threshold of 27 °C, and for 1991-2020 that number are obtained with a threshold of 28 °C. Conversely if we look at the number of ‘heatwave days’ against a fixed temperature threshold the count approximately doubles between 1961-1990 and 1991-2020, from 3-4 days to 7-8 days for a 26 °C threshold, and from 1-2 days to 3-4 days for 28 °C. The chart also shows the occurrences above 29 °C, which are also rising, and are likely to replace the current threshold at some point in the future.
The intention of the heatwave definition is to represent the hottest periods with respect to the current climate, and therefore the thresholds are intended to update each decade as the standard reference climate periods update. This provides stability in the definition on the scale of 10 years, while allowing the thresholds to respond appropriately to the changing climate. This also maintains consistency over time in the approximate number of events that meet the heatwave definition, at a level that they are common enough to reflect public discourse and not be limited to the rarest or most extreme events, but not so common as to become meaningless.
However, it should be noted that the heatwave definition on its own is not designed to be a tool for monitoring climate change. We have extensive data and reports that provide detailed and continual monitoring of UK climate, most notably as summarised in the Met Office annual State of the UK Climate report, and the increasing body of evidence quantifying our changing extremes such as recent reports on high-impact weather in the UK or the role of climate change in Europe’s record breaking summer of 2021. It can also be said that the update to the heatwave definition was itself an opportunity to talk about the impact climate change was already having in the UK, because the change in the heatwave threshold carries that message too.
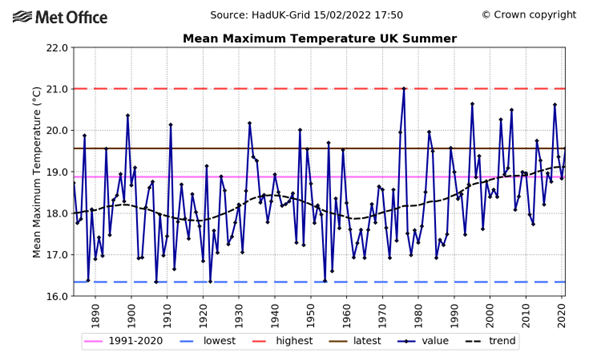
Heatwave definitions have evolved several times in the past to respond to user-need or changing circumstance. We also update the ‘standard reference climate normals’ every ten years, following the guidance of the World Meteorological Organization, most recently updating to 1991-2020 (Figure 3). These reference normals are used for routine monitoring of weather and climate, placing weather into the context of the current climate. But it can be argued that there is no evidence that past updates have been detrimental to our ability to talk about and communicate climate change and the associated risks and impacts, and therefore there is no reason to think that this most recent update will do either.
About the Author
Mark McCarthy is the Scientific Manager of the Met Office National Climate Information Centre. He's responsible for a team that monitors past and present climate change in the UK. This can range from providing expert analysis on month-long weather statistics, to long term climate change trends that can be observed in the UK's weather records.
____________________________________________________________________________
1 Based on a countywide average temperature derived from the Met Office HadUK-Grid dataset
2 In reality, heatwave occurrence is more sporadic with some years, like 1976, 1995, and 2018, having a high heatwave day count and some years having none.
 © Ed Hawkins, University of Reading")


