The Ladybird Expert Guide to Climate Change
In this annex to The Ladybird Expert Guide to Climate Change (purchase the book here) we provide additional information, links to further information and references to the scientific literature. Please note that for some of the scientific publications only the abstract is free to view. The links are provided as a sample of the relevant literature and are not meant as an exhaustive list or a comprehensive synthesis.
A number of the references are to the Intergovernmental Panel on Climate Change (IPCC), which is the international body for assessing the science related to climate change. It produces regular assessment reports, written by hundreds of leading scientists, which summarise the published literature.
Every effort has been made to ensure the accuracy of the information presented here, however, if any omission or error has been made please contact us at info@rmets.org.
This page will be updated as new evidence becomes available.
The term 'climate' is used as a short hand way of summarising the weather experienced over a particular period of time. This typically includes information – the average conditions, range and frequency of extremes for example – about temperature, precipitation, wind and other weather-related quantities over a period of time, ranging from months to thousands or millions of years. For more details see the frequently asked questions from the World Meteorological Organization (WMO) and the climate briefing papers from the the Royal Meteorological Society (RMetS).
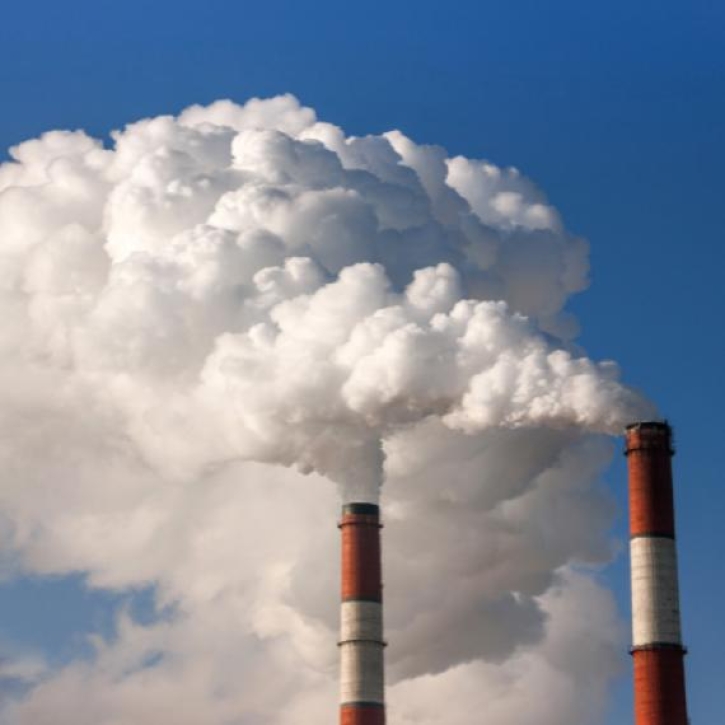
The diameter of the Earth (12, 742 km) and an apple (80 mm) are approximately one thousand times the depth of the layer of the atmosphere, known as the 'troposphere', in which most weather systems reside (12 km) and the apple skin (0.08 mm), respectively. For further details of the greenhouse effect see Frequently Asked Question 1.3 from Working Group 1 of the IPCC's Fourth Assessment Report IPCC AR4 WG1 FAQ1.3 and this article on the basics of climate change from the Royal Society. Greenhouse gases include carbon dioxide, water vapour, methane and nitrous oxide. Unlike the other greenhouse gases, water vapour is not considered a pollutant in this context. This is because the amount of water vapour in the atmosphere is variable, being strongly dependent on temperature, and is primarily a consequence of evaporation from the oceans.
For the latest update on the levels of greenhouse gases in the atmosphere see the WMO Greenhouse Gas Bulletin.
For more details of the observed changes and their impacts see, Summary for Policymakers (SPM), Synthesis Report (SYR), of the IPCC's Fifth Assessment Report (AR5): IPCC AR5 SYR SPM.
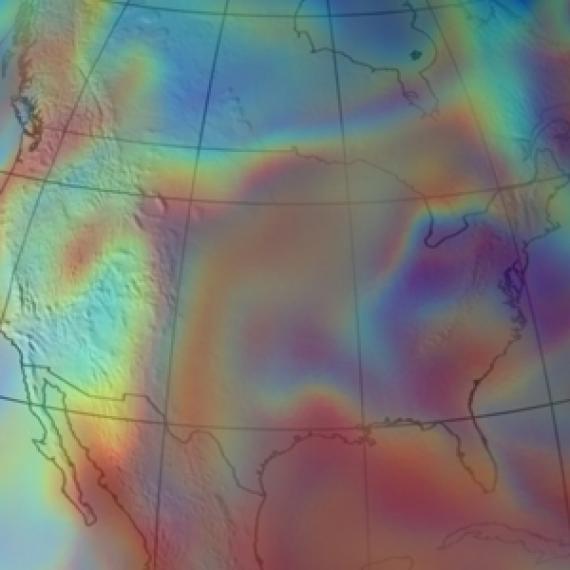
The US National Aeronautics and Space Administration (NASA) measures various aspects of the Earth's atmosphere (composition, temperature, rainfall etc) from space using satellites such as the Orbiting Carbon Observatory (OCO)-2, which measures carbon dioxide. The European Space Agency (ESA) also has a series of satellites measuring the composition of the Earth's atmosphere.
CarbonBrief has provided a description of how satellites are used to monitor climate change.
The global temperature record produced by the Met Office Hadley Centre and Climatic Research Unit (HadCRUT4) shows that 2015 was 0.75 ± 0.1°C above the long-term (1961-1990) average, a record since at least 1850. When compared with the pre-industrial period, the 2015 average global temperature was around 1°C above the long-term average from 1850 to 1900. Other groups also produce surface temperature datasets, for example the NASA Goddard Institute for Space Studies (NASA GISS) and the National Oceanic and Atmospheric Administration National Climatic Data Center (NOAA NCDC). These are produced separately to HadCRUT4 and use different methodologies but provide similar results. CarbonBrief has produced an explainer of what temperature records from surface measurements and satellites tell us. Gridded maps show that some regions have warmed more than others, in particular the Arctic region has seen significantly greater warming than the global average.
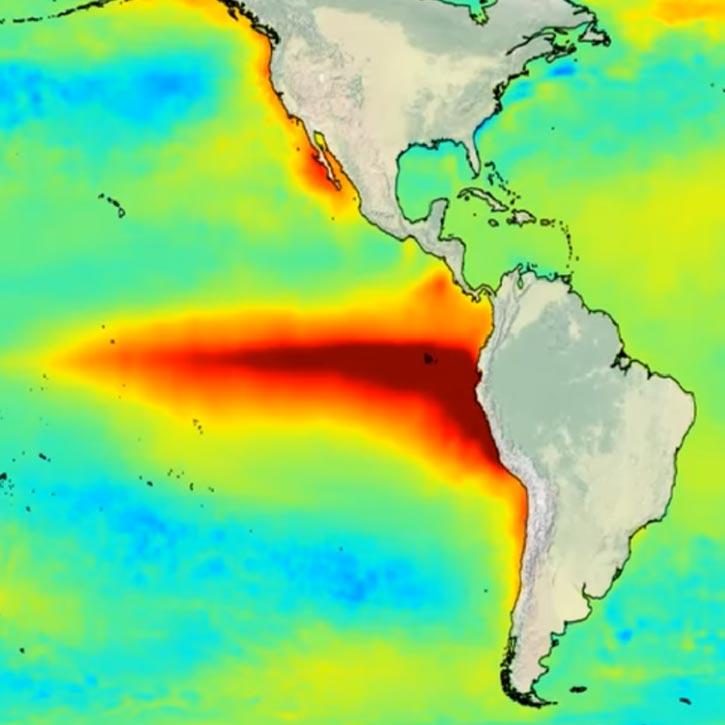
A natural weather cycle known as El Niño added to the warmth of 2015 and 2016 but the greatest contribution to these record warm years is thought to have been long-term climate change arising from increasing greenhouse gases. Current projections from the Met Office suggest that 2017 will be another very warm year globally but is unlikely to be a new record due to the absence of additional warming from El Niño.
For a full assessment of the temperature changes since 1850 and other recent climatic changes see the IPCC's Summary for Policymakers IPCC, AR5, WG1, SPM.
See the Bulletin of the American Meteorological Society's State of the Climate Report for a full set of climate indicators known as Essential Climate Variables.
Data plotted in the figure comes from the HadCRUT4 dataset of global surface temperatures. This combines the CRUTEM4 land-surface air temperature dataset and the HadSST3 sea-surface temperature dataset. The sea-surface measurements come from ships and buoys.
The temperature data is shown as the increase since 1850-1900. While late 19th century temperatures are commonly taken to be indicative of pre-industrial, there is no fixed period that is used as standard. There are limitations in available data in the earlier instrumental record, making the average temperature in the reference period less certain. Therefore 1850-1900 is chosen here as the most reliable reference period, which also corresponds to the period chosen by IPCC to represent a suitable earlier reference period. For alternative visualisations of this data and details of the uncertainty ranges see Prof Tim Osborn's website.
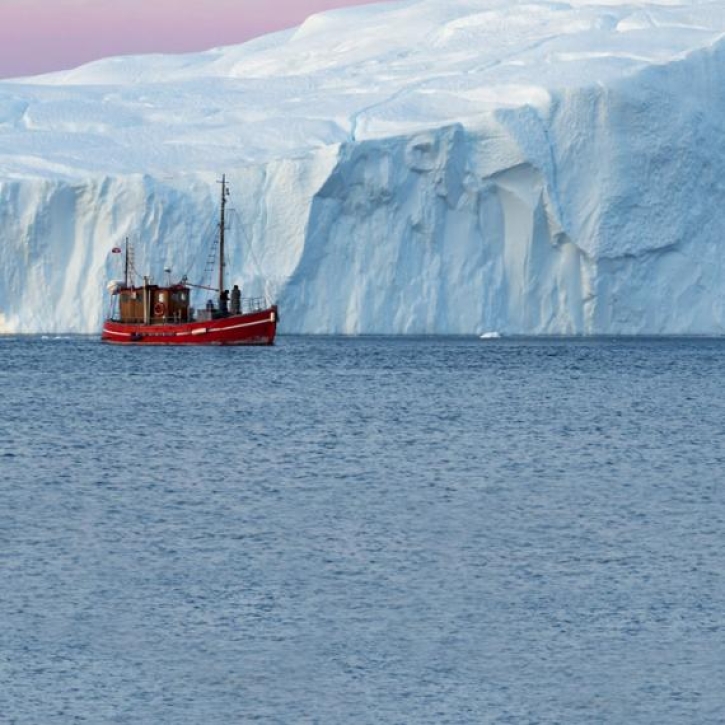
Arctic sea ice has seen a strong decrease in extent over recent years. Data is available from the US National Snow and Ice Data Center. Research ships, such as the RRS Sir David Attenborough which is currently being built, monitor changes to our oceans and conduct targeted measurements aimed at improving our understanding of the climate system. In addition, thousands of robotic floats sample the ocean depths around the world every day.
The average extent of Arctic sea ice at its annual summer minimum for the years 1979-2000 was 6.7 million square kilometres. In 2007, 2008, 2010, 2011, 2012, 2015 and 2016 the minimum extent did not reach above 4.6 million square kilometres. This reduction of 2.1 million square kilometres is equivalent to the combined area of the UK, Ireland, France, Spain, Germany and Italy. To date the record minimum extent, 3.39 million square kilometres, was reached in 2012. Data for sea ice volume (extent and thickness) are available from the Pan-Arctic Ice Ocean Modeling and Assimilation System (PIOMAS). Much on-going research is focused on understanding the possible connection between Arctic sea ice and changes to weather across Europe, Asia and North America. See for example Overland et al., The Melting Arctic and Midlatitude Weather Patterns: Are They Connected? Journal of Climate, 2015 also Barnes, E. A. and Screen, J. A. The impact of Arctic warming on the midlatitude jet-stream: Can it? Has it? Will it? WIREs Clim Change, 2015.
The two major causes of sea level rise are thermal expansion caused by warming of the oceans (since water expands as it warms) and the loss of land-based ice, such as glaciers and ice sheets, due to increased melting. For further details see Rietbroek et al., Revisiting the contemporary sea-level budget on global and regional scales, PNAS, 2016. Over the last two decades, the Greenland and Antarctic ice sheets have been losing mass and since 1992 the polar ice sheets have contributed, on average, 0.59 ± 0.20 mm per year to the rate of global sea-level rise (see Shepherd et al., A Reconciled Estimate of Ice-Sheet Mass Balance, Science, 2012). In addition, glaciers have shrunk almost worldwide (see Roe, Baker and Herla, Centennial glacier retreat as categorical evidence of regional climate change, Nature Geoscience, 2016). Since the mid-19th century, sea levels have been rising at an increasing rate, see data from tide gauges, based on Church and White, Sea-level rise from the late 19th to the early 21st Century, Surveys in Geophysics, 2011 and from satellites. Satellite data shows that some places have seen more sea level rise than others, as expected from our understanding of the physics. For further details of changes to ice and sea level see IPCC AR5 WG1 SPM.
The growing exposure to flooding of coastal cities and the cost of flood defences is documented in Hallegatte et al, Future flood losses in major coastal cities, Nature Climate Change, 2013. Average economic losses from flooding worldwide totalled US$6bn in 2005. Even with new investment in flood protection measures this is expected to rise substationally by 2050; without such investment, the study finds that annual losses could exceed USS$1 trillion per year. A perspective from the insurance industry is given in the Allianz Risk Pulse report The megacity state. Hurricane/Post Tropical Strom Sandy struck the New Jersey coast on October 29, 2012, inflicting billions of dollars of damage to residential and commercial facilities as well as transportation and other infrastructure along the coastline and well into the interior of the states impacted. For a final damage report see The Economic Impact of Hurrricane Sandy from the US Department of Commerce.
The Environment Agency has produced a detailed strategic flood risk management plan for London and the Thames estuary through to the end of the century Thames Estuary 2100: Managing flood risk through London and the Thames Estuary, Environment Agency, 2012, see also the ice2sea project report, which notes that with a sea-level rise of 100cm flooding would exceed the Thames Barrier an average of once in 12 years.
Sea level rise has the potential to increase the risk of storm surges. A study (Tebaldi, Strauss and Zervas, Modelling sea level rise impacts on storm surges along US coasts, Environmental Research Letters, 2012) of the US coastline which combined future global sea level rise projections with historic tide gauge water levels at 55 sites, found that for about one third of the areas considered, today's 'once in a century' storm surges may become 'once in a decade' storms in future.
For an overview of Hurricane Sandy and the storm surge that hit New York City see Storm Surge Hurricane Sandy, Our Changing Climate, and Extreme Weather of the Past and Future, Adam Sobel, Harper Collins, 2014. Evidence suggests that warmer sea temperatures and sea level rise meant the storm surge and associated damage were influenced by climate change, see Trenberth, Fasullo and Shepherd, Attribution of climate extreme events, Nature Climate Change, 2015.
According to Munich Re's NatCatSERVICE, approximately 850,000 people lost their lives between 1980 and 2014 as a result of weather-related catastrophes worldwide and global financial losses amounted to $93 billion in 2015 alone, see Topics Geo Natural Catastrophes 2015.
Record-breaking temperatures were reported in Phalodi, Rajasthan in 2016, see Provisional WMO Statement on the Status of the Global Climate in 2016. Scores of deaths in London during the 2003 heatwave have been attributed to climate change, see Mitchell et al, Attributing human mortality during extreme heat waves to anthropogenic climate change, Environmental Research Letters, 2016. Across Europe it has been estimated that some 70,000 additional deaths occurred in Europe during the hot summer 2003, see Robine et al, Death toll exceeded 70,000 in Europe during the summer of 2003, Comptes Rendus Biologie, 2008. For an overview of Australian bush fires see Dutta et al, Big data integration shows Australian bush-fire frequency is increasing significantly, Royal Society Open Science, 2016. The UK Climate Change Risk Assessment 2017 provides an overview of the weather and climate related risks for the UK. For the impact of the Pakistan floods in 2010 see for example Warraich et al, Floods in Pakistan: a public health crisis, Bulletin of the World Health Organization, 2011. Note that it has not been possible to determine conclusively whether or not climate change increased the risk of the Pakistan floods in 2010, see Christadis et al, A New HadGEM3-A-Based System for Attribution of Weather- and Climate-Related Extreme Events, Journal of Climate, 2013.
A summary of extreme weather conditions around the world can be found in the World Meteorological Organisation's annual Statement on the State of the Climate. An overview of climate change and extreme weather is provided in IPCC AR5 WG2 Part B. The Royal Society report, Resilience to Extreme Weather, 2014 documents the risk of extreme weather and climate and the steps required to build resilience to such events.
It has been estimated that the return time for a European heatwave of the magnitude of 2003 reduced from thousands of years at the end of last century (1990-99) to tens or hundreds of years (best estimate of 127 years) by the decade 2003-2012, see Christidis et al, Dramatically increasing chance of extremely hot summers since the 2003 European heatwave, Nature Climate Change, 2015. Heatwaves in the UK like that experienced in 2003 are expected to become the norm in summer by the 2040s. The average number of hot days per year has been increasing since the 1960s, and currently 2,000 people die prematurely each year in the UK from heat-related conditions. The growing, ageing population means the number of vulnerable people at risk is increasing. In combination this means the number of premature heat-related deaths is expected to more than triple by the 2050s. The impacts will not be limited to southern England. There is evidence that newer homes are at a greater risk of overheating than older designs. Delayed introduction of policies to ensure that homes, hospitals, care facilities, schools and prisons, and business premises, are safe and operable in high temperatures will increase risks and lead to longer-term wellbeing impacts.
A number of studies have found an increased risk of specific floods as a consequence of climate change, for example Schaller et al, Human influence on climate in the 2014 southern England winter floods and their impacts, Nature Climate Change, 2016, Kay et al, Attribution of Autumn/Winter 2000 flood risk in England to anthropogenic climate change: A catchment-based study, Journal of Hydrology, 2011 and Pall et al, Anthropogenic greenhouse gas contribution to flood risk in England and Wales in autumn 2000, Nature, 2011.
The UK Climate Change Risk Assessment 2017 found that the greatest direct climate change-related threats for the UK are large increases in flood risk and exposure to high temperatures and heatwaves, shortages in water, substantial risks to UK wildlife and natural ecosystems, risks to domestic and international food production and trade, and risks from new and emerging pests and diseases. A warmer atmosphere can hold more moisture, leading to heavier rainfall and more frequent flooding, including outside of recognised flood risk areas. Higher temperatures will affect public health, infrastructure, business, farming, forestry and the natural environment. Dry periods, when combined with higher temperatures, are likely to result in more severe and prolonged droughts. Projected sea level rise of 50-100 centimetres by 2100 will exacerbate flood risks and accelerate the process of coastal change for exposed communities. A study has shown that climate change likely increased the risk of floods occurring in England and Wales in autumn 2000 by more than 90 per cent, see Pall et al, Anthropogenic greenhouse gas contribution to flood risk in England and Wales in autumn 2000, Nature, 2011.
The impacts of flooding and coastal change in the UK are already significant and are expected to increase as a result of climate change. Improving flood protection for some communities will be possible, whilst others will face the prospect of significantly increased risks. This will affect property values, business revenues and in extreme cases the viability of communities. Risks to communities and local economies are closely linked to the resilience of local infrastructure, in particular energy, transportation and communications systems.
The floods of autumn 2000 were particularly severe. The worst affected areas were Kent and Sussex during October, and Shropshire, Worcestershire and Yorkshire during November. Further information concerning the flooding in Uckfield, Sussex is provided by the Geographical Association. The news reels from the Uckfield floods in autumn 2000 highlighting the rescue efforts of the emergency services.
According to the UK Climate Change Risk Assessment 2017:
• Heatwaves in the UK like that experienced in 2003 are expected to become the norm in summer by the 2040s. The average number of hot days per year has been increasing since the 1960s, and currently 2,000 people die prematurely each year in the UK from heat-related conditions. The growing, ageing population means the number of vulnerable people at risk is increasing. Combining these factors, this means the number of premature heat-related deaths is expected to more than triple by the 2050s.
• There is a risk of shortages in water supply for the public, agriculture, energy generation and industry, with impacts on freshwater ecology. In addition, climate change presents a substantial risk to the UK's native wildlife and to the vital goods and services provided by natural capital, including food, timber and fibre, clean water, carbon storage, and the cultural benefits derived from landscapes.
• Extreme weather events affecting international production, trade and supply chains could make food prices volatile with occasional spikes. Longer term incremental changes in climate are likely to alter the agricultural productivity of regions that are important for global food production. There is the potential for domestic production to increase in a warmer climate but this will be constrained unless more action is taken to address the declining quality of soils and projected water deficits in the most productive UK regions.
• Furthermore, the impacts of new and emerging pests and diseases are potentially high for otherwise healthy people, animals and plants. The warmer, wetter conditions expected with climate change will allow some pests and diseases to extend their range. Disease outbreaks are difficult to predict, have widespread direct as well as indirect impacts on communities and economies, and are very expensive to manage once established.
The range of risks and impacts that can be expected to accompany climate change are detailed in IPCC AR5 WG2 SPM. Various studies have investigated the influence of climate change and climate variability on crop yields, for example Challinor et al., A meta-analysis of crop yield under climate change and adaptation, Nature Climate Change, 2014 and Ray et al., Climate variation explains a third of global crop yield variability, Nature Communications, 2015. The IPCC AR5 WG2 SPM concluded with high confidence that based on many studies covering a wide range of regions and crops, negative impacts of climate change on crop yields have been more common than positive impacts. Furthermore, for the major crops (wheat, rice, and maize) in tropical and temperate regions, climate change without adaptation is projected to negatively impact production for local temperature increases of two degrees C or more above late-20th-century levels, although individual locations may benefit.
The UN's Food and Agriculture Organisation sets out the evidence as to how climate change brings a cascade of risks from physical impacts to ecosystems, agro-ecosystems, agricultural production, food chains, incomes and trade, with economic and social impacts on livelihoods and food security and nutrition, in their 2016 report, Climate change and food security: risks and responses.
Food price volatility arises from a number of factors, including those linked with climatic change. A 2011 report from the Prince of Wales's International Sustainability Unit presents an overview of how extreme weather during recent years has led to food price volatility: What price resilience? Towards sustainable and secure food systems. See also IPCC AR5 WG2 SPM.
Water scarcity severely impairs food security and economic prosperity in many countries today. Pressure on available water resources is expected to increase due to population changes, and future climate change is likely to exacerbate regional and global water scarcity considerably, see for example Schewe et al., Multimodel assessment of water scarcity under climate change, PNAS, 2014.
For a review of Himalayan glaciers and the influence of climate change on regional water supplies see Himalayan Glaciers: Climate Change, Water Resources, and Water Security, National Academies Press, 2012.
Climate change poses a range of threats to human health and survival in multiple, interacting ways. Impacts can be direct (e.g., heatwaves and extreme weather events such as a storm, forest fire, flood, or drought) or indirectly mediated through the effects of climate change on ecosystems (e.g., agricultural losses and changing patterns of disease), economies, and social structure (e.g., migration and conflict). Given this, the 2015 Lancet Commission on Health and Climate Change concluded that 'the effects of climate change are being felt today, and future projections represent an unacceptably high and potentially catastrophic risk to human health'.
Climate change over the 21st century is projected to increase displacement of people. Moreover, climate change can indirectly increase risks of violent conflicts in the form of civil war and inter-group violence by amplifying well-documented drivers of these conflicts such as poverty and economic shocks. The impacts of climate change on the critical infrastructure and territorial integrity of many states are expected to influence national security policies, and evidence indicates that when violent conflict occurs it increases vulnerability to climate change. For further details see IPCC AR5 WG2 SPM. A number of studies have considered the role of climate change in present-day conflict and refugee situations, with mixed conclusions about the relative importance of climate change; for example Kelley et al, Climate change in the Fertile Crescent and implications of the recent Syrian drought, PNAS, 2015, De Chatel, The Role of Drought and Climate Change in the Syrian Uprising: Untangling the Triggers of the Revolution, Middle Eastern Studies, 2014 and Bergaoui et al, The contribution of human-induced climate change to the drought of 2014 in the southern Levant region, in Explaining Extreme Events of 2014 from a Climate Perspective, Bulletin of American Meteorological Society, 2015.
Climate change has the potential to impact water supply. Locations such as the Indian Himalayan region are particularly vulnerable to the effects of climate change, with population growth placing additional pressure on water resources. Freshwater supply is influenced by the amount and timing of rainfall, snow and glacial melt. For a review of the present state of knowledge see Singh et al., Changing climate and glacio-hydrology in Indian Himalayan Region: a review, WIRES Climate Change, 2016. For a review of Himalayan glaciers and the influence of climate change on regional water supplies see Himalayan Glaciers: Climate Change, Water Resources, and Water Security, National Academies Press, 2012.
Many terrestrial, freshwater, and marine species have shifted their geographic ranges, seasonal activities, migration patterns, abundances, and species interactions in response to ongoing climate change. In the past, natural changes in climate that occurred at a slower rate than the present changes caused significant ecosystem shifts and species extinctions. A large fraction of both terrestrial and freshwater species faces increased extinction risk under projected climate change, especially as climate change interacts with other stressors. For further details see IPCC AR5 WG2.
CarbonBrief have produced a summary report on what the current science says regarding polar bears and climate change. The International Union for Conservation of Nature (IUCN) produced a report in 2009, Species and climate change: more than just the polar bear, which details ten flagship species, chosen as a representative sample of the sorts of species that may suffer from climate change affecting land, ocean and river habitats: staghorn corals, ringed seals, leatherback turtles, emperor penguins, quiver trees, clownfish, arctic foxes, some salmon, koalas and beluga whales.
Recent findings indicate that warmer and more acidic waters threaten the viability of some salmon species in some regions, see for example Munoz et al., Adaptive potential of a Pacific salmon challenged by climate change, Nature Climate Change 2015, Ou et al., Responses of pink salmon to CO2-induced aquatic acidification, Nature Climate Change 2015 and Wade et al., Steelhead vulnerability to climate change in the Pacific Northwest, Journal Applied Ecology, 2013. Note that evidence also suggests that some salmon species may have some ability to adapt to limited temperature increases, e.g., Anttila et al., Atlantic salmon show capability for cardiac acclimation to warm temperatures, Nature Communications, 2014). Eastern Pacific populations of the leatherback turtle have declined by over 90% during the past three decades, primarily due to human pressures including unsustainable egg harvest, development on nesting beaches, and by-catch mortality. The effects of climate change may impose additional stresses, see Willis-Norton et al., Climate change impacts on leatherback turtle pelagic habitat in the Southeast Pacific, Deep Sea Research, 2015. See also Tomillio et al., Climate change overruns resilience conferred by temperature-dependent sex determination in sea turtles and threatens their survival, Global Change Biology, 2015 and Hawkes et al., Climate change and marine turtles, Endangered Species Research, 2009. There are significant concerns for the future of emperor penguins and a number of other penguin species under future climate change, see Jenouvrier et al., Projected continent-wide declines of the emperor penguin under climate change, Nature Climate Change, 2014 and Trathan et al., Pollution, habitat loss, fishing, and climate change as critical threats to penguins, Conservation Biology, 2014. In addition, there is increasing concern over how Arctic fauna, including Beluga whales, will adapt to climate-related changes in sea-ice, see for example O'Corry-Crowe et al., Genetic profiling links changing sea-ice to shifting beluga whale migration patterns, Biology Letters, 2016.
Future generations could live in a less diverse world due to the effects of climate change on wildlife populations. The US Environmental Protection Agency presents a summary of the threat to ecosystems, including how the rate of extinction of animals and plants is already thousands of times higher than the background rate, i.e., before human influences became important. See also, Barnosky et al, Has the Earth's sixth mass extinction already arrived?, Nature, 2011.
A recent review has found that up to one-sixth of all species may go extinct if we do not curb carbon emissions, with several regions, including South America, Australia, and New Zealand, facing the greatest risk, see Urban, Accelerating extinction risk from climate change, Science, 2015.
Some Australian species are illustrated as examples of wildlife which may be vulnerable to the impacts of climate change. For more details, see this summary from the Australian Museum: Australian species vulnerable to climate change. The population of yellow-footed rock wallabies is known to fluctuate with rainfall and their vulnerability to climate change, along with those of other Australian species, is detailed in Lee et al., Mapping the Drivers of Climate Change Vulnerability for Australia's Threatened Species, PLOS One, 2015. The golden-shouldered parrot is thought to be vulnerable to climate change, along with other birds such as the buff-breasted buttonquail, see Reside et al., Vulnerability of Australian tropical savanna birds to climate change, Austral Ecology, 2016. Climate change and associated factors have been predicted to have a major detrimental impact on Lumholtz's Tree Kangaroo, acting directly or indirectly through reduction in rainforest area, reduction in foliar nitrogen concentration, habitat degradation due to increased incidence of severe cyclones, increased incidence of high temperatures, and reduced incidence of free water in mist, see Woinarski and Burbidge, Dendrolagus lumholtzi, The IUCN Red List of Threatened Species, 2016.
A 2015 report from the Bank of England sets out the impact of climate change on the UK insurance sector.
The UN's Food and Agriculture Organisation presents a summary of the relationships between drought and food security and shows how the incidence of drought has increased during recent decades, causing impacts on food production. Note that more recent updates on the scientific understanding around droughts indicates that increased heating from global warming may not cause droughts, but it is expected that when droughts occur they are likely to set in more quickly and be more intense, see Trenberth et al., Global warming and changes in drought, Nature Climate Change, 2014. More generally the influence of extreme weather on global crop yields is reviewed in Lesk et al., Influence of extreme weather disasters on global crop production, Nature, 2016 and further discussion can be found in the 2011 Foresight Report on Food and Farming from the UK Government Office for Science. The agricultural losses due to the 2011 Texan drought are estimated to have reached a record $7.62 billion.
The world's electricity sector strongly depends on the availability and temperature of water resources for hydropower generation, and for cooling of thermoelectric (nuclear, fossil-fuelled, biomass-fuelled and geothermal) power. Heatwaves, droughts and other extreme weather have impacts on these water resources, see van Vliet et al., Power-generation system vulnerability and adaptation to changes in climate and water resources, Nature Climate Change, 2016. The implications for hydropower in Brazil are discussed in de Lucena et al, The vulnerability of renewable energy to climate change in Brazil, Energy Policy, 2009.
For more on the food-energy-water nexus see IPCC AR5 WG2 SPM and Box CC-WE.
In 2011, the state of Texas experienced a record-breaking heatwave and drought, see Nielsen-Gammon, The 2011 Texas Drought, Texas Water Journal, 2012. The total financial impact on agricultural production is estimated to have been $7.62 billion. The estimated total cost to the Texan economy is $12.5 billion, when the downstream effects on the local economy are included, see Guerrero, The impact of agricultural drought losses on the Texas economy 2011, AgriLife Briefing Paper, 2012. A number of studies have found that the likelihood of an extreme summer heatwave in Texas was many times greater as a consequence of climate change, see Rupp et al., Anthropogenic influence on the changing likelihood of an exceptionally warm summer in Texas, 2011, Geophysical Research Letters, 2015. Moreover, a recent study has indicated that in the future under climate change, multi-year droughts may occur across the state, see Venkataraman et al., 21st century drought outlook for major climate divisions of Texas based on CMIP5 multimodel ensemble: Implications for water resource management, Journal of Hydrology, 2016.
For an extensive discussion of snowball (e.g. during the Proterozoic) and hothouse (e.g. during the Cretaceous and Eocene) climates see Pierrehumbert, Principles of Planetary Climate, Cambridge University Press, 2010.
The wobbles in the Earth's orbit about the sun are known as Milankovich cycles. For a recent study discussing the impact of these cycles and atmospheric carbon dioxide levels on the inception of ice ages see Ganopolski et al, Critical insolation-CO2 relation for diagnosing past and future glacial inception, Nature, 2016.
For sea level at the last ice age see Lambeck et al, Sea level and global ice volumes from Last Glacial Maximum to the Holocene, PNAS, 2014. For population at the last ice age see Tallavaara et al, Human population dynamics in Europe over the Last Glacial Maximum, PNAS, 2015. According to the UK Census, the population of Cambridge, England in 2011 was 123,867.
The mammoth became extinct following a decline that saw most populations dying out by about 10,000 years ago. This is believed to have been caused by either climate change or hunting, or a combination of the two, see for example Cooper et al, Abrupt warming events drove Late Pleistocene Holarctic megafaunal turnover, Science, 2015, see also Nogues-Bravo et al., Climate Change, Humans, and the Extinction of the Woolly Mammoth, PLOS Biology, 2008.
Detailed analyses of ocean sediments, ice cores, and other data show that the Earth has repeatedly moved between ice ages and warmer periods repeatedly over the past 2.6 million years at least, triggered by recurring variations in Earth's orbit about the Sun that primarily alter the regional and seasonal distribution of solar energy reaching Earth. These relatively small changes in solar energy are reinforced over thousands of years by gradual changes in Earth's ice cover (the cryosphere), especially over the Northern Hemisphere, and in atmospheric composition, eventually leading to large changes in global temperature. The average global temperature change during an ice-age cycle is estimated as 5°C ± 1°C.
The climate of the last ice age was much less stable than the Earth has experienced over the last 10,000 years. It went through a series of abrupt warming and gradual cooling oscillations known as Dansgaard-Oeschger cycles, see for example Schmidt and Hertzberg, Abrupt Climate Change During the Last Ice Age, Nature Education Knowledge, 2011. The origin of these oscillations is still debated, see Henry et al, North Atlantic ocean circulation and abrupt climate change during the last glaciation, Science, 2016 for a recent discussion of the role of changes in ocean circulation.
For further reading on the broader effects of climate on human development and history see Burroughs, Climate Change in Prehistory, Cambridge University Press, 2005.
For a summary of the evidence regarding the causes of recent warming and the dominant contribution from human activities, see IPCC AR5 WG1 SPM (further details are given in the Technical Summary and Frequently Asked Questions).
The Royal Society has provided answers to many common questions to do with the causes of climate change.
The IPCC has provided a description of the greenhouse effect. Emissions of carbon dioxide from the burning of fossil fuels and other sources are tracked by the Global Carbon Project. Note also that the increase in carbon dioxide in the atmosphere can be linked to the burning of fossil fuels through the signature in isotopes of carbon and of the nitrogen/oxygen ratio; for further details see Rubino et al., A revised 1000-year atmospheric δ13C-CO2 record from Law Dome and South Pole, Antarctica, Journal of Geophysical Research, 2013.
For the latest annual greenhouse gas levels see the WMO Greenhouse Gas Bulletin. Methane levels in 2014 were 1833 parts per billion (ppb), more than 150% higher than in the pre-industrial period. In 2016, carbon dioxide levels surpassed 400 parts per million (ppm) at Halley Research Station in Antarctica, as recorded by the British Antarctic Survey.
The growth since 1970 in emissions of different greenhouse gases is presented in IPCC AR5 WG3 SPM. This also provides a breakdown of their sources: electricity, heat production and other energy (34.6%), agriculture, forestry and other land use (24%), industry (21%), transport (14%) and buildings (6.4%). The UK's national contribution to greenhouse gas emissions is detailed in an annual report.
The Global Carbon Project provides the breakdown of the flow of carbon through the Earth system. For further information see also IPCC AR5 WG1 FAQ 6.2 What happens to carbon dioxide after it is emitted into the atmosphere?.
For temperatures at the last ice age compared to the present day see Annan and Hargreaves, A new global reconstruction of temperature changes at the Last Glacial Maximum, Climate of the Past, 2013. For projections of temperature increase over this century see IPCC AR5 WG1 SPM.
Data presented in the figure is for the perturbation of the global carbon cycle caused by human activities, averaged globally for the decade 2005-2014 (GtCO2/yr), see Global Carbon Budget 2015. For the latest update see Global Carbon Budget 2016.
The 20-fold increase in global energy use since 1850 is charted in the Global Energy Assessment, International Institute for Applied Systems Analysis2012. This also reveals the changing energy mix and how during the 20th century there was a huge increase in the consumption of fossil fuels.
The BP Statistical Review of World Energy provides estimates of global primary energy use; see the IEA's energy unit converter for conversions between million tonnes of oil equivalent (MtOe) and exajoules (EJ). In 2015 global energy use was estimated to be: 4331 MtOe = 181 EJ (oil), 3135 MtOe = 131 EJ (gas), 3840 MtOe = 161 EJ (coal), 583 MtOe = 24 EJ (nuclear), 893 MtOe = 37 EJ (hydroelectric) and 365 MtOe = 15 EJ (renewables). The International Energy Agency (IEA) estimates there is approximately a further 1200 MtOe = 50 EJ of energy use from non-commercial, traditional sources such as biomass; see for example their description of Bioenergy and Key Energy Statistics.
The IEA's World Energy Outlook 2015 estimates that 1.2 billion people, 17% of the global population, did not have access to electricity in 2013. Many more suffer from supply that is of poor quality. More than 95% of those living without electricity are in countries in sub-Saharan Africa and developing Asia, and they are predominantly in rural areas (around 80% of the world total). The World Energy Outlook Special Report 2016: Energy and Air Pollution notes that energy production and use are by far the largest man-made sources of air pollutants. According to the world health statistics from the World Health Organization (WHO), more than 3 billion people use wood and other solid fuels for cooking, and kerosene for lighting. This creates smoky environments that are associated with around 4.3 million premature deaths each year. Coal and oil combustion in power plants, industrial facilities and vehicles is associated with outdoor pollution linked to around 3 million premature deaths each year. Jointly around 6.5 million premature deaths each year can be attributed to air pollution, according to the WHO.
See the Global Energy Assessment, International Institute for Applied Systems Analysis 2012 for an overview of historic fossil fuel use.
Forests were initially most extensively cleared for farming in the temperate regions. More recently forest loss has increased in tropical latitudes. For an historical perspective on forest loss see State of the World's Forests 2016 produced by the UN's Food and Agriculture Organisation (FAO).
The loss of temperate forests over the past ten thousand years is discussed in Williams, Dark ages and dark areas: global deforestation in the deep past, Journal of Historical Geography, 2000. For the reasons for the loss of different species of large animal, including the pressures arising from the clearance of temperate forests to make way for farming see Navarro and Pereira, Rewilding Abandoned Landscapes in Europe, Ecosystems, 2012. Deforestation is a leading cause of regional species loss, see Sodhi et al., Causes and Consequences of Species Extinctions in Princeton Guide to Ecology, 2009, see also Daleszczyk et al., Mammal Species Extinction and Decline: Some Current and Past Case Studies of the Detrimental Influence of Man, Problematic Wildlife, Springer, 2016.
Peatlands contain vast quantities of carbon. Although peatlands cover just 2-3% of the Earth's land area they contain about a quarter of the world's soil carbon. Deforestation on peatlands can thus contribute very substantial emissions of carbon dioxide to the atmosphere. For an overview see Turetsky et al., Global vulnerability of peatlands to fire and carbon loss, Nature Geoscience, 2015. A recent study estimated the carbon loss caused by coastal peat swamp forest conversion into oil palm plantation with periodic burning was 1400 tonnes of carbon per hectare over 100 years, which is equivalent to about 2900 years of carbon accumulation in a hectare of coastal peatlands, see Kurnianto et al., Carbon accumulation of tropical peatlands over millennia: a modelling approach, Global Change Biology, 2014. For a review of the peatlands of South-East Asia and the link between deforestation and drainage, and accelerating carbon emissions arising from peat mineralization and fire see Page and Hooijer, In the line of fire: the peatlands of Southeast Asia, Philosophical Transactions of the Royal Society B, 2016.
Forest clearance to make way for agriculture continues to add emissions to the atmosphere, with the farming sector overall contributing about a quarter of total emissions, including from the manufacture of fertiliser and release of methane from digestion by ruminant animals. For a detailed breakdown see Smith et al, Chapter 11: Agriculture, Forestry and Other Land Use, IPCC, AR5, WG3. For the effect of deforestation on rainfall see for example Makarieva et al, Why Does Air Passage over Forest Yield More Rain?, Journal of Hydrometeorology, 2014.
The IUCN RED list provides details of endangered and critically endangered species including Organg Utan, Eastern and Western Gorilla, Tiger and Sumatran and Javan Rhinoceros.
The Forestry Commission has provided a guide to how Britain's forests were shaped. See also A brief history of our forests from the Future Trees Trust.
For the 800,000-year record of carbon dioxide levels from ice cores see Lüthi et al, High-resolution carbon dioxide concentration record 650,000-800,000 years before present, Nature, 2008. Over this time period, carbon dioxide levels varied naturally between about 170 parts per million (ppm) and 300 ppm. Carbon dioxide levels now exceed 400 ppm, see the latest meausrements from Mauna Loa Observatory, Hawaii.
For the unprecedented rate of current release of carbon dioxide see Zeebe et al, Anthropogenic carbon release rate unprecedented during the past 66 million years, Nature Geoscience, 2016. For past rates of warming see Shakun et al, Global warming preceded by increasing carbon dioxide concentrations during the last deglaciation, Nature, 2012.
See IPCC AR5 WG1 FAQ 6.2 for what happens to carbon dioxide after it is emitted into the atmosphere. See also the Royal Society's briefing: If emissions of greenhouse gases were stopped, would the climate return to the conditions of 200 years ago?.
The British Antarctic Survey has provided a briefing on ice cores. The carbon dioxide data shown in the figure is from Lüthi et al, High-resolution carbon dioxide concentration record 650,000-800,000 years before present, Nature, 2008. Download the data from the figure.
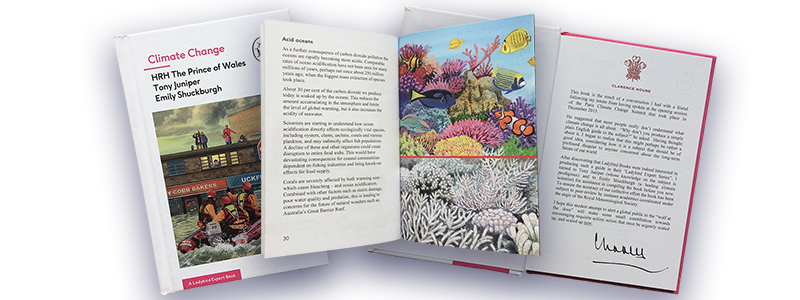
The oceans are becoming more acidic, or technically less alkaline. A substantial body of scientific literature on the effects of ocean acidification is now available, for example Nagelkerken and Connell, Global alteration of ocean ecosystem functioning due to increasing human CO2 emissions, PNAS, 2015, Ekstrom et al, Vulnerability and adaptation of US shellfisheries to ocean acidification, Nature Climate Change, 2015, Dutkiewicz et al, Impact of ocean acidification on the structure of future phytoplankton communities, Nature Climate Change, 2015, Nagelkerken et al, Ocean acidification alters fish populations indirectly through habitat modification, Nature Climate Change, 2015, Mongin et al, The exposure of the Great Barrier Reef to ocean acidification, Nature Communications, 2016 and Barton et al, Impacts of coastal acidification on the Pacific Northwest shellfish industry and adaptation strategies implemented in response, Oceanography, 2015.
The Smithsonian Museum of Natural History presents a comprehensive summary of the causes and effects of ocean acidification, see also IPCC AR5 WG2, especially box CC-CR and a report from the Marine Climate Change Impacts Partnership.
Surveys have shown that 2016 saw the largest die-off of corals ever recorded on Australia's Great Barrier Reef due to a bleaching event caused by warm seas. A recent study has shown that bleaching events of the past three decades have been mitigated by induced thermal tolerance of reef-building corals, but that this protective mechanism is likely to be lost under near-future climate change scenarios, see Ainsworth et al., Climate change disables coral bleaching protection on the Great Barrier Reef, Science, 2016. Indeed studies indicate that even modest future warming will threaten the majority of the world's coral reefs, see e.g., Frieler et al., Limiting global warming to 2°C is unlikely to save most coral reefs, Nature Climate Change, 2013. Coral reefs such as the Great Barrier Reef are also under threat from a range of other stresses including pollution, illegal fishing, invasive species and ocean acidification.
IPCC AR5 WG1 Chapter 12 provides a summary of the scientific understanding of potentially abrupt or irreversible environmental changes.
For a clear summary of past temperatures, sea levels and states of the Greenland and Antarctic ice sheets see Dutton et al, Sea-level rise due to polar ice-sheet mass loss during past warm periods, Science, 2015. In 2012 and 2015 the Greenland Ice Sheet, which contains enough ice to raise sea levels by about seven metres if it all melted, experienced melting over more than half of its surface, see State of the Climate in 2015, Bulletin American Meteorlogical Society, 2016. Feldmann and Levermann, Collapse of the West Antarctic Ice Sheet after local destabilization of the Amundsen Basin, PNAS, 2015, provides a review of recent studies indicating a destabilization of the West Antarctic Ice Sheet in the Amundsen Sea sector. They note that if this has indeed been initiated, Antarctica will irrevocably contribute at least 3 metres to global sea-level rise during the coming centuries to millennia.
Forest fires in Indonesia have during recent decades caused massive carbon emissions to the atmosphere, including because of peatland blazes, see Page et al., The amount of carbon released from peat and forest fires in Indonesia during 1997, Nature, 2002 and also Yin et al., Variability of fire carbon emissions in equatorial Asia and its nonlinear sensitivity to El Nino, Geophysical Research Letters, 2016. For the risk of Amazonian dieback see Brando et al, Abrupt increases in Amazonian tree mortality due to drought-fire interactions, PNAS, 2014 and also this summary from the Met Office.
Lenton et al, Tipping elements in the Earth's climate system, PNAS, 2008 also sets out an overview of critical 'tipping points' that might abruptly hasten the pace of warming. For recent results concerning the release of methane from frozen stores in the Arctic see e.g., Walter Anthony et al., Methane emissions proportional to permafrost carbon thawed in Arctic lakes since the 1950s, Nature Geoscience, 2016 and James et al., Effects of climate change on methane emissions from seafloor sediments in the Arctic Ocean: A review, Limnology and Oceanography, 2016.
Around the globe, forest ecosystems are increasingly undergoing changes in function, structure and species composition due to alterations in climate, nitrogen deposition, anthropogenic pressures and their interactions. Climate-induced forest dieback in the future cannot be ruled out for forest ecosystems of global importance such as the Amazon rainforest or the boreal forests. For a recent review see Reyer et al., Forest resilience, tipping points and global change processes, Journal of Ecology, 2015.
Global average temperature estimates are provided by a number of agencies including the Met Office, NASA and NOAA.
IPCC AR5 WG2 SPM highlights the risk of death, injury, ill health, or disrupted livelihoods in low-lying coastal zones and small island developing states and other small islands, due to storm surges, coastal flooding, and sea level rise. Recent research has started to investigate the complex interactions between sea level rise and shoreline processes, see for example Albert et al., Interactions between sea-level rise and wave exposure on reef island dynamics in the Solomon Islands, Environmental Research Letters, 2016 and Ford and Kench, Multi-decadal shoreline changes in response to sea level rise in the Marshall Islands, Anthropocene, 2015, also Carrasco et al., Coastal lagoons and rising sea level: A review, Earth-Science Reviews, 2016.
For peak global mean temperature, atmospheric carbon dioxide, maximum global mean sea level, and sources of meltwater, in particular the fraction of ice retreat in Greenland and Antarctica 400,000 years ago, see figure in review summary of Dutton et al, Sea-level rise due to polar ice-sheet mass loss during past warm periods, Science, 2015.
The text of the Paris Agreement on climate change adopted by virtually all countries in the world in 2015 explicitly states that an overall aim is to pursue efforts that will limit global average temperature increase to below 2°C, and if possible to below 1.5°C, compared with the pre-industrial era.
The central finding from the Lancet Commission on Health and Climate Change was that tackling climate change could be the greatest global health opportunity of the 21st century, see Watts et al, Health and climate change: policy responses to protect public health, The Lancet, 2015.
An assessment of key impacts of climate change at warming levels of 1.5°C and 2°C, including extreme weather events, water availability, agricultural yields, sea-level rise and risk of coral reef loss is provided by Schleussner et al., Differential climate impacts for policy-relevant limits to global warming: the case of 1.5C and 2C, Earth System Dynamics, 2016; see CarbonBrief for a summary. Ricke et al., Policy thresholds in mitigation, Nature Geoscience, 2016 also shows a substantial increase in the impact of climate change between 1.5° and 2°C across a range of sectors.
A number of studies have investigated the threshold for Greenland to pass into an essentially ice-free state, for example Robinson et al, Multistability and critical thresholds of the Greenland ice sheet, Nature Climate Change, 2012 who find it to be in the range of 0.8-3.2°C, with a best estimate of 1.6°C.
To have a good chance (66%) the warming will not go beyond 2°C this century and of ensuring there is a reasonable chance (50%) chance that by 2100 the warming is no more than 1.5°C above pre-industrial global average temperatures, there must be net zero carbon dioxide emissions globally by the middle of the century (2045-2060), see Rogelj et al., Energy system transformations for limiting end-of-century warming to below 1.5C, Nature Climate Change, 2016. The Energy and Climate Intelligence Unit have produced a tool for assessing the implications of different pathways of emissions reductions, see their blog: If you ruled the world... when would you like carbon emissions to peak?.
The total allowable emissions for a likely (66%) chance to keep global average temperature less than 2°C above pre-industrial levels is estimated to be 3670 billion tonnes of carbon dioxide, which reduces to around 3000 billion tonnes when taking into account greenhouse gas emissions other than carbon dioxide. For details see Peters et al., Measuring a fair and ambitious climate agreement using cumulative emissions, Environmental Research Letters, 2015. Cumulative past emissions from 1870 to 2014 are estimated to be about 2000 billion tonnes of carbon dioxide – in other words, we have already used about two-thirds of the carbon budget for 2°C. Annual emissions in 2015 were just under 40 billion tonnes, taking into account the contributions from burning fossil fuels and cement manufacture as well as deforestation and land-use changes. For details and the latest updates of these numbers see Global Carbon Project.
See IPCC AR5 WG1 FAQ 12.3 for a description of what would happen to future climate if we stopped emissions today.
For details and the latest updates of these numbers see Global Carbon Project. Total fossil carbon available is estimated to be 3670 to 7100 billion tonnes of carbon dioxide (reserves) and 31300 to 50050 billion tonnes (resources), see IPCC AR5 SYR Table 2.2.
See Carbon Tracker for reports on the value of fossil fuel energy sources which cannot be burnt if the world is to adhere to a given carbon budget, for example Unburnable Carbon.
For a detailed overview of opportunities to reduce emissions from the energy supply sector, as well as reducing energy demand, see IPCC AR5 WG3, in particular chapters 7-11.
The Global Calculator is a website that allows exploration of a low-carbon world in 2050 with different choices concerning our energy future. See 2050 Energy Calculator for a version focused on the UK.
On the potential for renewable energy to meet a very substantial proportion of global energy demand, the IPCC produced a special report in 2011 Renewable Energy Sources and Climate Change Mitigation, which pointed out how a range of different studies have consistently found that the total global technical potential for renewable energy is substantially higher than global energy demand.
Staying within low-carbon budgets requires an enormous scale up of the contribution of low-carbon emission technologies: fossil fuels with carbon capture and storage (CCS), renewable energy, bio-energy (including bio-energy with CCS), and nuclear power, see for example van Vuuren et al., Carbon budgets and energy transition pathways, Environmental Research Letters, 2016. The IEA provides an annual report tracking clean energy progress. The International Renewable Energy Agency (IRENA) has produced a report REthinking Energy: Renewable Energy and Climate Change, on the role of renewable energy in decarbonising the global energy mix. In 2015 the IEA produced a report on the future potential of nuclear energy, Technology Roadmap: Nuclear Energy, see also their Frequently Asked Questions on nuclear energy. A 2016 report from the National Audit Officeprovides an overview of the future cost of nuclear power in the UK, see in particular figure 12.
A 2015 report from the Climate Council sets out the issues and potential linked with the trends in battery technology, the rise of electric vehicles and the falling costs of power from renewable sources. For the potential of carbon capture and storage (CCS) see for example the 2015 report from the IEA, Carbon Capture and Storage: The solution for deep emissions reductions. On CCS see also the summary from the European Academies Scientific Advisory Council: Capturing carbon to tackle climate change.
The matching of energy supply with that of demand via smart grids and smart meters, using cutting-edge digital technologies and new energy storage technologies could transform energy systems, making them far more efficient and better able to harness renewable energy. The UK’s National Infrastructure Commission sets out the potential in the UK context in their 2016 report: Smart Power.
The need for technologies to remove carbon dioxide to keep temperatures below 1.5°C is discussed in Rogelj et al., Energy system transformations for limiting end-of-century warming to below 1.5C, Nature Climate Change, 2016, see also Gasser et al, Negative emissions physically needed to keep global warming below 2°C, Nature Communications, 2015. An overview of carbon dioxide removal options is provided by CarbonBrief. The need to consider the limitations of some of these options is discussed in Smith et al, Biophysical and economic limits to negative CO2 emissions, Nature Climate Change, 2015.
Sustainable Energy – without the hot air by David MacKay is an excellent and pragmatic assessment of future energy options with an emphasis on making sure the numbers actually add up. The chapter on smarter heating notes that in Britain, for every degree that you turn the thermostat down, the heat loss from your home decreases by about 10%.
Tropical Forests, A Review, published in 2015 by The Prince of Wales's International Sustainability Unit, examined published evidence relating to the relationship between tropical forests and climate change and concluded that a combination of protection and restoration of tropical forests could lead to between 24-33% of the carbon savings needed to combat climate change.
A synthesis of assessments of the value of forests is provided by The Economics of Ecosystems and Biodiversity (TEEB) project; see the 2010 report, Mainstreaming the economics of nature. Tropical rainforests contribute to national development in the countries where they remain through replenishing freshwater, protecting against flooding, conserving biodiversity and providing forest products including food, fuel and timber. For a review of the multiple ways in which such forests (and other healthy ecosystems) contribute to economic development see Juniper, What has Nature ever done for us? Profile Books, 2013.
Modern strategies for the protection of forests which, as well as providing development benefits, capture and store carbon from the atmosphere, involve assisting smallholders to adopt sustainable farming practices. In relation to cocoa, a number of chocolate companies are seeking to integrate forest conservation with sustainable farmer livelihoods, for example Cocoa Life.
Up to one-fifth of the global population, 1.3 billion people, derives direct and indirect benefits from forests in the form of employment, forest products, and contributions to livelihoods and incomes, see this 2016 report from the World Bank. About 350 million people who live within or close to dense forests depend on them for their subsistence and income. Forests have the capacity to store and sequester carbon as well as to provide ecosystem services that enhance the resilience of natural systems to climate change. This means that the sustainable management of forests plays a central role in meeting development and climate goals.
The majority of the Earth's terrestrial carbon is stored in the soil, and there is concern that the warming of the climate will stimulate the loss of this carbon to the atmosphere, which would further planetary warming, see Crowther et al., Quantifying global soil carbon losses in response to warming, Nature, 2016. For an overview of soil carbon storage see Ontl and Schulte, Soil Carbon Storage, Nature Education Knowledge, 2012.
The 4 in 1000 initiative was launched at the Paris Climate Summit in 2015 to encourage actions in farming to increase soil carbon, thereby reducing atmospheric levels.
Regarding the extent to which adding charcoal to soil can be an effective option for climate change mitigation, see for example Scheub, Terra Preta. How the world's most fertile soil can help reverse climate change and reduce world hunger, Greystone books, 2016. Soil organic matter not only holds more carbon in the ground and thus leads to less in the atmosphere, but also retains water in ways that promote crop production, including by increasing resilience to drought, see the summary on creating drought-resistant soil from the UN's Food and Agriculture Organisation (FAO).
Dietary changes could provide health benefits and reduce food-related greenhouse gas emissions, see Springmann et al., Analysis and valuation of the health and climate change cobenefits of dietary change, PNAS, 2016.
An integrated approach to managing landscapes - cropland, livestock, forests and fisheries - can address the interlinked challenges of food security and climate change, see Climate-Smart Agriculture and this overview from the World Bank.
For a fuller explanation on the circular economy see Tse et al, How business can support a circular economy, Harvard Business Review, 2016, the Ellen MacArthur Foundation and also the Royal Society for the encouragement of Arts, Manufactures and Commerce (RSA)'s Great Recovery Project. For more on how circular patterns of economic development can contribute to resilient economic growth, see this 2012 report from Chatham House, the Royal Institute of International Affairs: A Global Redesign? Shaping the Circular Economy. See also a number of recent publications from the European Academies Science Advisory Council (ESAC) including Circular economy: a commentary from the perspectives of the natural and social sciences, and two reports on critical materials and indicators for a circular economy.
A circular economy reduces detrimental impacts by treating waste as new resources. Two illustrative examples of how the circular economy works are presented, one biological and one material. The same basic ideas can be applied across the economy using a variety of biological nutrients and materials, see Juniper, What's really happening to our planet? Dorling Kindersley, 2016.
See here for the full speech by HRH The Prince of Wales at the COP21 Opening Session, Paris, 2015.
See the United Nations' sustainable development knowledge platform for more details of the Sustainable Development Goals.
The Paris Agreement's central aim is to strengthen the global response to the threat of climate change by keeping a global temperature rise this century well below 2°C above pre-industrial levels, and to pursue efforts to limit the temperature increase even further to 1.5°C. Additionally, the agreement aims to strengthen the ability of countries to deal with the impacts of climate change. To reach these ambitious goals, appropriate financial flows, a new technology framework and an enhanced capacity building framework will be put in place, thus supporting action by developing countries and the most vulnerable countries, in line with their own national objectives. The Agreement also provides for enhanced transparency of action and support through a more robust transparency framework. The Paris Agreement includes provision for combatting deforestation and forest degradation; see this summary from the World Resources Institute.
The Paris Agreement requires all Parties to put forward their best efforts through 'nationally determined contributions' (NDCs) and to strengthen these efforts in the years ahead. This includes requirements that all Parties report regularly on their emissions and on their implementation efforts.
The United Nations Environment Programme produces an annual report on global progress emissions reductions. The Emissions Gap Report highlights that even if fully implemented, the emission cuts that countries have promised to make unconditionally are only consistent with keeping global warming below 3.2°C by 2100 (see also Climate Action Tracker). If developing countries receive the funds promised by rich nations and use them for additional emission constraints as they have pledged, that would shave an additional 0.2°C off future temperature rise. However, studies indicate that some countries, such as China, are likely to cut emissions further and faster than they have pledged; and in 2018 countries will review their progress, with a view to tightening constraints.
The language of the Paris Agreement was negotiated by representatives of 195 countries at the 21st Conference of the Parties of the United Nations Framework Convention on Climate Change (UNFCCC) in Paris and adopted by consensus on 12 December 2015. The Agreement entered into force on 4 November 2016.
For the opportunities presented through responding to climate change see the reports of the Global Commission on the Economy and Climate: Better Growth, Better Climate (2014), Seizing the Global Opportunity (2015) and The Sustainable Infrastructure Imperative (2016).
For developments in clean energy technologies see the IEA's annual report Tracking Clean Energy Progress.
In 2015 The Prince of Wales's Corporate Leaders Group coordinated an energy efficiency commitment for the buildings supply chain, to help drive delivery of 'nearly zero energy buildings' for new build by 2020, and refurbished buildings by 2030.
The year 2015 saw the global threshold of 1 million electric cars on the road exceeded, see the IEA's report Global Electric Vehicle Outlook 2016 for more details. For progress on biofuels for aviation see Chuck, Biofuels for Aviation: Feedstocks, Technology and Implementation, Elsevier, 2016, see also the European Advanced Biofuels Flightpath.
A number of major companies and brands have during recent years adopted zero deforestation and net zero deforestation policies. Many such policies have been adopted in the context of the cross-sectoral business and government Tropical Forest Alliance 2020.
The Cambridge Institute for Sustainability Leadership has produced a ten-year plan to lay the foundations for a sustainable economy, see Rewiring the Economy: Ten tasks, ten years. See also the report Future Proofing: Sustainable plans for prosperous economies from The Prince of Wales's Corporate Leaders Group.
Responding positively to the climate challenge through strategies to cut emissions (mitigation) and build resilience (adaptation) can reduce future climate risks and promote sustainable development, see IPCC AR5 SYR SPM.
The world population (7.4 billion in 2016) is expected to reach 8.5 billion by 2030, 9.7 billion in 2050 and 11.2 billion in 2100, see the UN's World Population Prospects report.
On the subject of Nature's boundaries, the Stockholm Resilience Centre presents an assessment as to the extent to which different thresholds are being pressured through human activities. A summary can be found in Rockstrom et al., A safe operating space for humanity, Nature, 2009 and Steffen et al., Planetary boundaries: Guiding human development on a changing planet, Science, 2015.
For a description of a more balanced, sustainable world that the human race must create to survive see HRH The Prince of Wales, Tony Juniper, Ian Skelly, Harmony, Harper Collins, 2010.
The crew of the Apollo 17 spacecraft took a photograph of the Earth from a distance of about 45,000 kilometers (28,000 miles) on December 7, 1972. Known as Blue Marble, this has become one of the most reproduced images in human history.