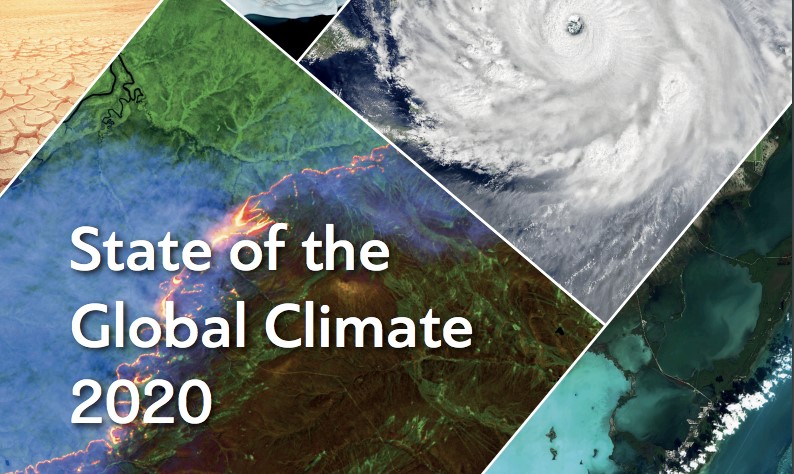

State of the Global Climate 2020
The World Meteorological Organization (WMO) has recently issued its latest report on the State of the Global Climate in 2020. This is part of a series that has been produced annually since 1993. The aim is to paint a picture of Earth’s current climate and how it is changing, based on worldwide observations of temperature, greenhouse gas concentrations, precipitation, sea levels, ocean heat content, amounts of ice and extreme events.
There are also three specific sections dedicated to:
- the Arctic, which has seen several records broken in the past year
- the impact of climate change on the United Nations’ Sustainable Development Goals
- information about the observation systems used
The importance of up-to-date and accurate data about the Earth’s climate is illustrated by the following quote from the Secretary General of the United Nations, Antonio Gutteres. In his Forward to the Report, he says, “We know that to avert the worst impacts of climate change, we must keep global temperatures to within 1.5 °C of the pre-industrial baseline. That means reducing global greenhouse gas emissions by 45 per cent from 2010 levels by 2030 and reaching net-zero emissions by 2050.”
We have highlighted some of the headline observations from the report below.
Temperature
The Global Mean Temperature for 2020 was 1.2⁰C above the 1850-1900 average. It was one of the three warmest years on record. Of particular note was the warmth experienced in Siberia. Parts of this region saw mean temperatures 6⁰C above average and a record Arctic temperature of 38⁰C was set at Verkhoyansk on 20 June 2020. Elsewhere in the Arctic, there were record highs set in Canada and Svalbard, whilst Finland had its warmest year on record. The fact that all this happened in a year that ended with a ‘La Niña' (ENSO) event is remarkable in itself since that normally leads to a slight cooling effect.
Greenhouse Gases and Ozone
All three of the major Greenhouse Gases, carbon dioxide (CO2), methane (CH4) and nitrous oxide (N2O) have continued to increase in concentration in the atmosphere despite the temporary reductions in emissions due to the Covid-19 pandemic. Over the Arctic and Antarctic, the ozone holes which develop every spring were significantly larger and more long-lasting than in recent years. Although the halons and chlorofluorocarbons (CFCs) which wrought the damage initially have been phased out of use, it will be many decades before their atmospheric concentrations fall. In the meantime, particularly cold conditions in the polar stratosphere, such as happened in 2019-20, will continue to promote significant ozone destruction.
Seas and Oceans
Sea levels have continued to rise overall, although the picture is not uniform with local changes dependent upon temperature, salinity, heat absorbed and ice melt. 84% of the world’s oceans experienced at least one Marine Heat Wave; slightly less than the 88% observed in 2016. Ocean heat content, measured in the uppermost 2000m, was found to be very close to the record set in 2019.
In September, the sea ice minimum in the Arctic reached its second lowest area ever and there were also record low extents in both July and October. The winter maximum extent was also towards the low end of the annual data. The warmth in Siberia contributed to record low ice coverage and early melt in the Laptev Sea. In Antarctica, ice extents were similar to the long-term average.
Glaciers
Overall, glaciers continued to shrink, although at a somewhat reduced rate. However, there were particularly notable losses in Europe and New Zealand. Loss of ice from glaciers depends upon a complex set of factors including how well the ice is supported, the nature of the underlying surface and the presence or otherwise of a sub-surface supporting shelf near the end of the ice flow.
Extreme Events
Flooding was a feature of 2020, especially in Africa and Asia:
- the Horn of Africa (Ethiopia and Somalia) and the Sahel region (Senegal to Sudan) experienced above-average rainfall in the monsoon with Sudan and Kenya suffering extensive flooding. Lake Victoria reached record levels
- India, Pakistan and Bangladesh had a very wet monsoon season
- In China, the Yangtze River catchment experienced severe flooding and the Three Gorges Dam recorded the largest flood peak since its construction
- Vietnam already had the north east monsoon rains when it was hit by 8 tropical cyclones in 5 weeks. 1800 mm rain fell in one week at Hue
Drought conditions and heatwaves affected several areas:
- there were exceptionally hot and dry conditions in South America, with a record 44.6⁰C reported at Nova Maringa and Agua Clara in Brazil on 5 October. Serious wildfires developed in Argentina, Brazil and Paraguay
- the biggest wildfires ever recorded in the western United States burnt the largest area in 20 years.
- in Death Valley, California, the thermometer reached 54.4⁰C on 16 August; the highest known temperature in the World for at least 80 years
- wildfires which had started in 2019 amidst a heatwave stretching back to 2017 continued to beset Australia in January and New Zealand recorded its longest dry spell ever
- in the Middle East, Kuwait and Baghdad saw temperatures top 50⁰C in July and record highs were reported in Japan and Taipai as well
Cold and heavy snow were seen, especially in North America and Japan:
- Denver had significant snowfall in September, just 3 days after a record high temperature of 38.3⁰C
- A severe ice storm in Oklahoma cut power to half the city in October
- Although the European winter was generally mild, it was still cold enough for snow in the far north where large amounts of snowfall occurred. Record amounts fell in parts of northern Finland
- Record snowfall was seen in Honshu, Japan in December
It was an above-average season for tropical storm activity:
- In total, there were 98 named storms
- The Atlantic saw 30 such events, more than double the long-term average. 12 made landfall in the United States; the previous record was 9. The state of Louisiana alone was hit by five
- Cyclone Amphan, which moved into Bangladesh on 20 May, was the costliest on record for the north Indian Ocean with estimates reaching US$ 14 billion
- Tropical cyclone Gati became the first ever to make landfall in Somalia on 22 November
- Cyclone Harold damaged or destroyed 17,000 homes in Vanuatu in April and Typhoon Goni crossed the northern Philippines on 1 November with mean wind speeds (not gusts) of 220 kph (140mph)!
- In the Mediterranean, a ‘Medicane’ (sharing features of both a tropical storm and a mid-latitude depression) made landfall in Greece with winds of 110 kph on 18 September


